UniversalReporter for SmartPlant
Introduction
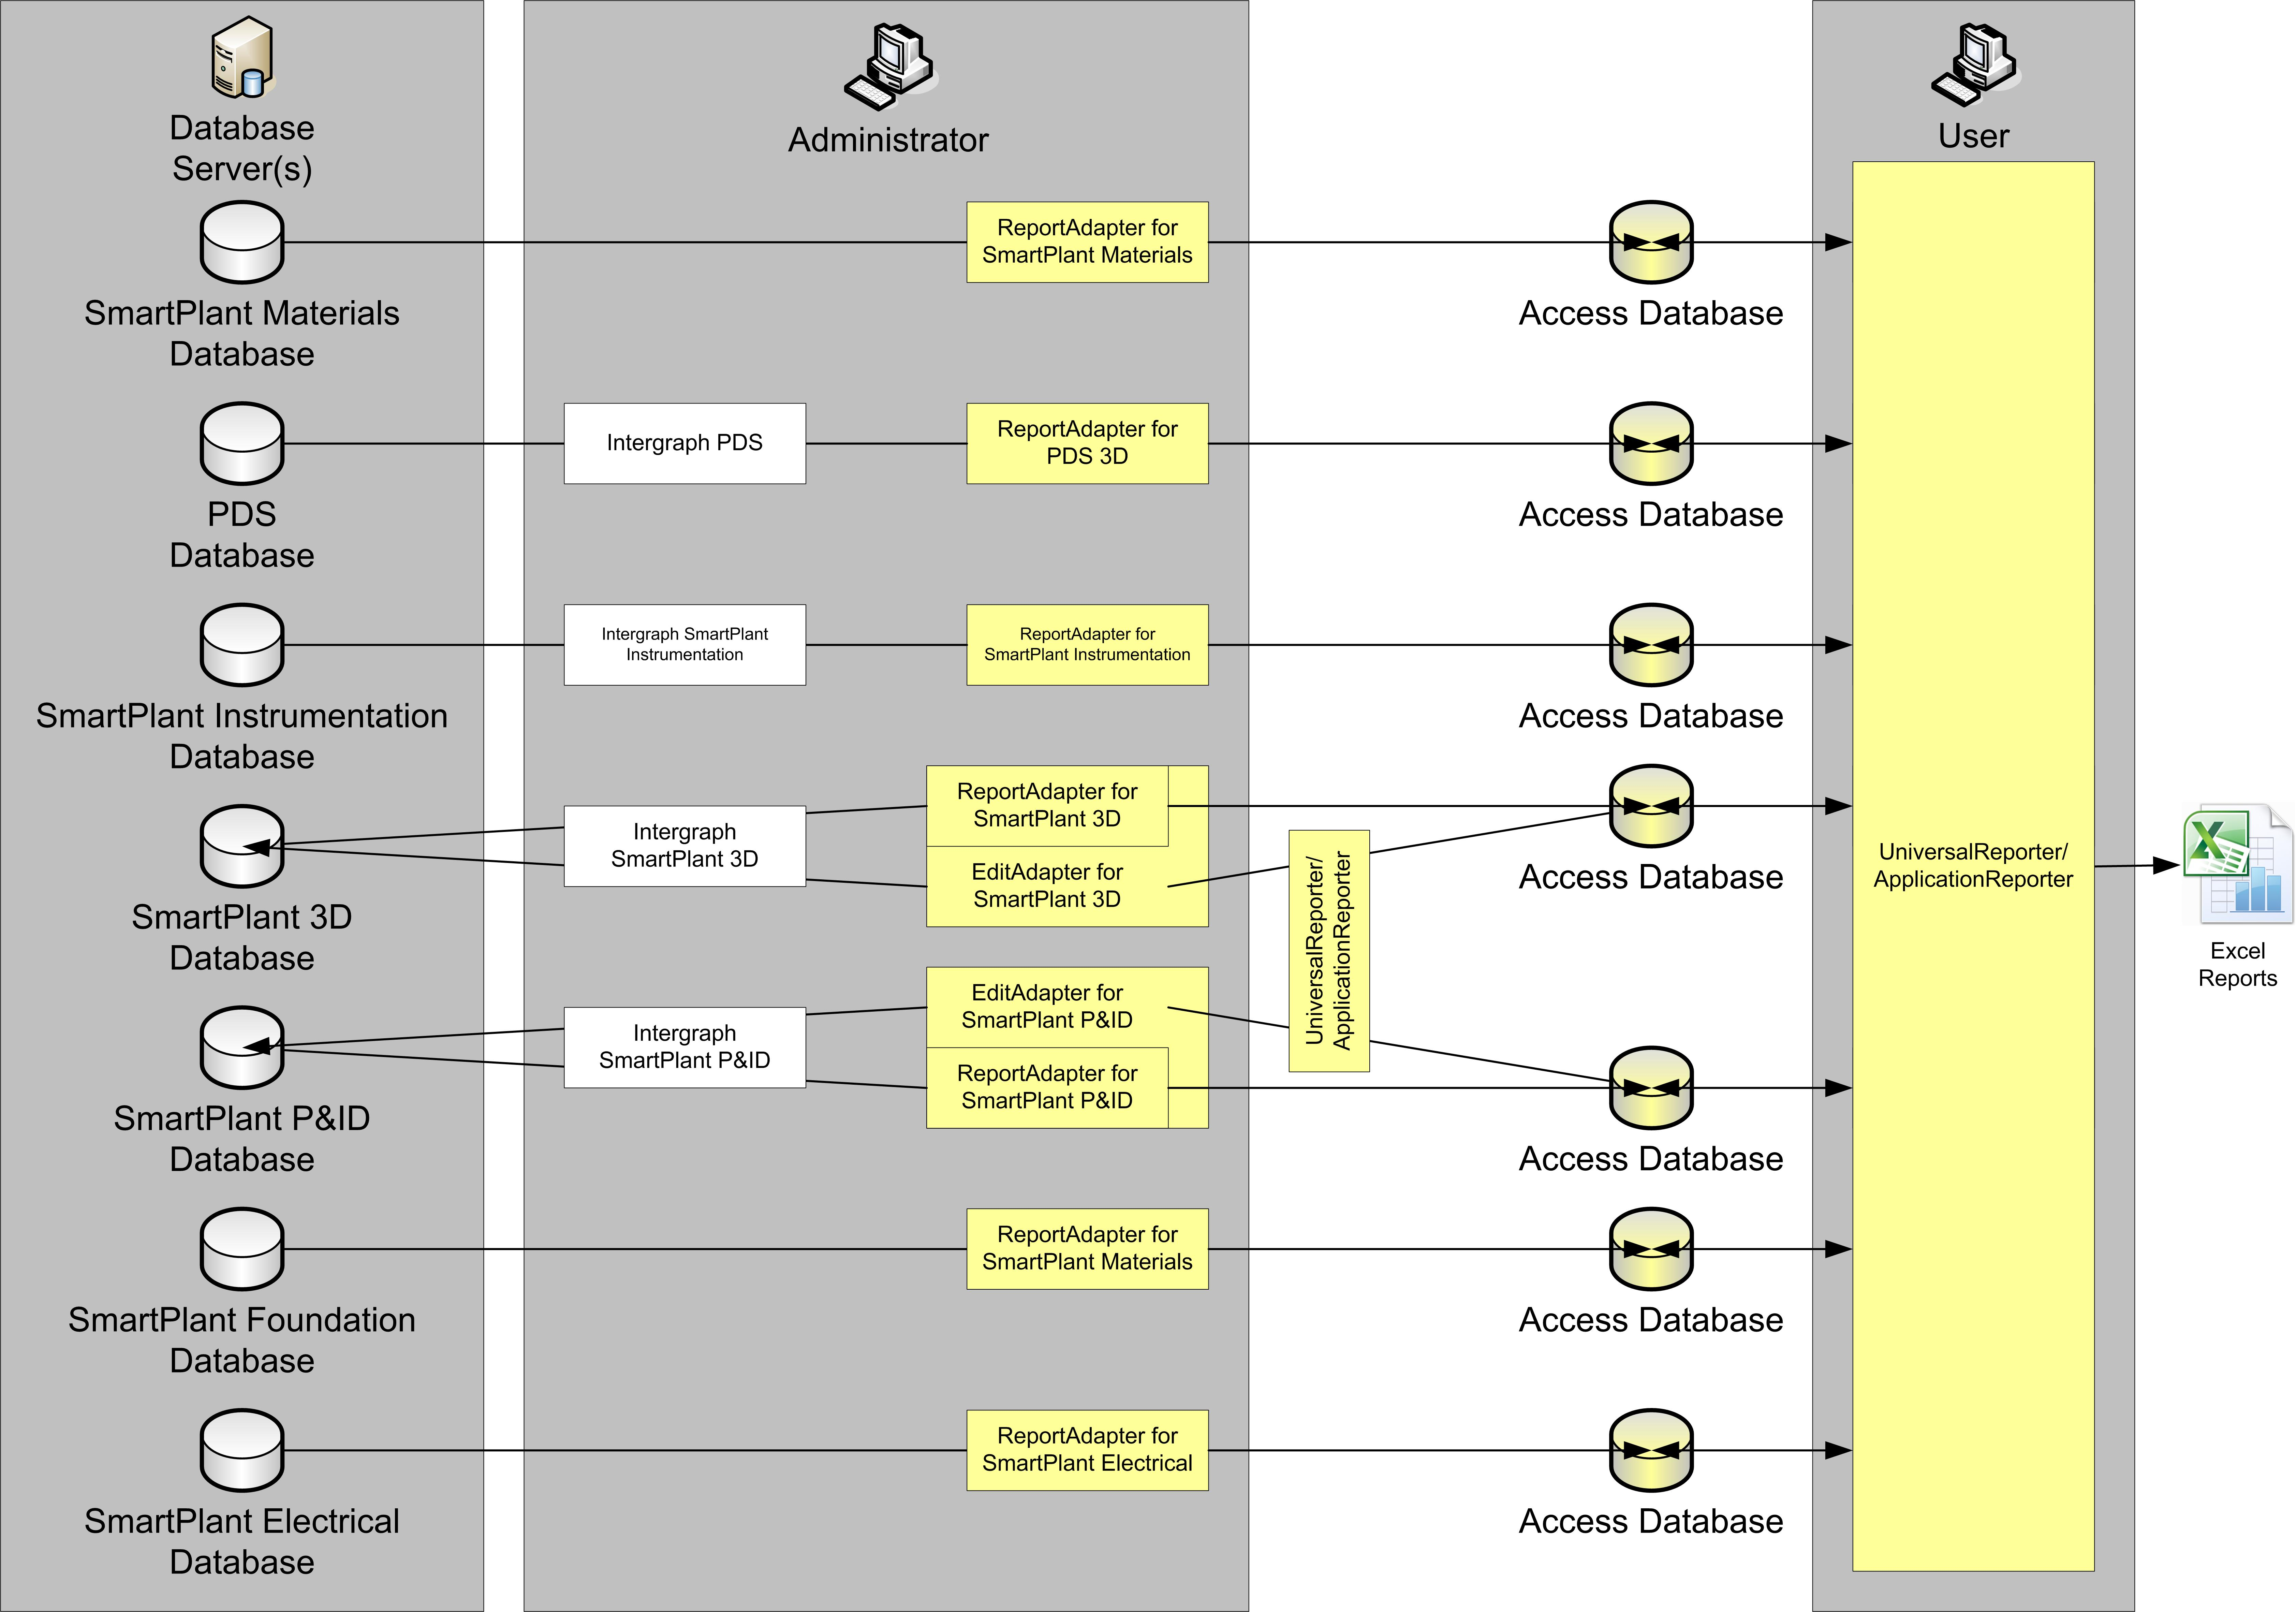
UniversalReporterSuite enables customers to extract, consolidate, review, report and edit against data of different Intergraph® applications.
Features
The UniversalReporter Suite encompasses the following features:
ReportAdapters enable the software to generate data files (in Microsoft® Access mdb format) for different Intergraph® applications. Each application will require its own adapter. Currently, adapters are available for:
PDS® 3D
PDMS
SmartPlant® 3D
SmartPlant® Materials
SmartPlant® P&ID
SmartPlant® Instrumentation
SmartPlant® Electrical
Microsoft® Excel®
In-house applications
UniversalReporter enables intuitive reporting against a single or multiple application data.
provides export of data to Microsoft® Excel,
creates report using customised templates,
allows saving of individual data views,
offers tools for configuring and renaming displayed attributes,
writes changes back to application (EditAdapter licence needed).
allows simultaneous usage of data from all available ReportAdapters,
enables simultaneous usage of data from all available ReportAdapters to and compare different applications, projects and versions,
creates “multi-application windows” incorporating data from many sources,
supports interaction between multi-application and single-application windows to enable quick comparison and editing.
The software to edit data is implemented in UniversalReporter and the ReportAdapters, but is available only if an EditAdapter license is installed.
For editing in-house application data an EditAdapter licence is not needed.
Prerequisites
Supported operating systems:
32 bit: Microsoft Windows Server 2003, Windows XP up to Windows 10
64 bit: Microsoft Windows 7 or later
Intergraph SmartPlant® 3D 2009.1 or later
Intergraph SmartPlant® P&ID 4.3 or later
Intergraph SmartPlant® Instrumentation 2007 or later
Intergraph SmartPlant® Electrical 2007 SP5 or later
Intergraph SmartPlant® Materials 2009 or later
Microsoft Office 2003 up to Office 2013
Adapter Licences
Depending on requirement, licences are issued for the following:
ReportAdapter for PDS® 3D
ReportAdapter for PDMS
ReportAdapter for SmartPlant® 3D
ReportAdapter for SmartPlant® Materials
ReportAdapter for SmartPlant® P&ID
ReportAdapter for SmartPlant® Instrumentation
ReportAdapter for SmartPlant® Electrical
ReportAdapter for SmartPlant® Foundation
ReportAdapter for Microsoft® Excel® (this adapter does not require a license)
ApplicationReporter for SmartPlant®
UniversalReporter for SmartPlant®
EditAdapter for SmartPlant® 3D
EditAdapter for SmartPlant® P&ID
EditAdapter for Microsoft® Excel® (this adapter does not require a license)
Usage
UniversalReporter
UniversalReporter creates reports from single applications but also across multiple applications and allows you to check, validate and combine data between applications. It permits simultaneous usage of data from available ReportAdapters. The system permits creation of multi-application windows so that the user can compare data between different versions of the same project or data between two different applications.
Starting UniversalReporter
Upon opening of the UniversalReporter, the system is typically set to recall the last used data files. However if no history is available or the user chooses to open a different data file, the steps are as follows:
Navigate to File → Open project (or use hotkey ALT+O).
The Open dialogue box appears:
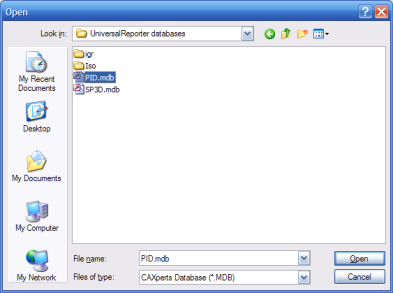
Navigate to the directory where the data (.mdb) file can be found. Select the file and click the Open button. The data file gets loaded.
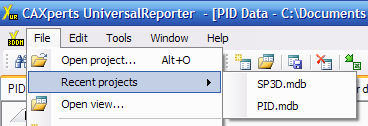
If you wish to load a previous data file, just select File → Recent projects.
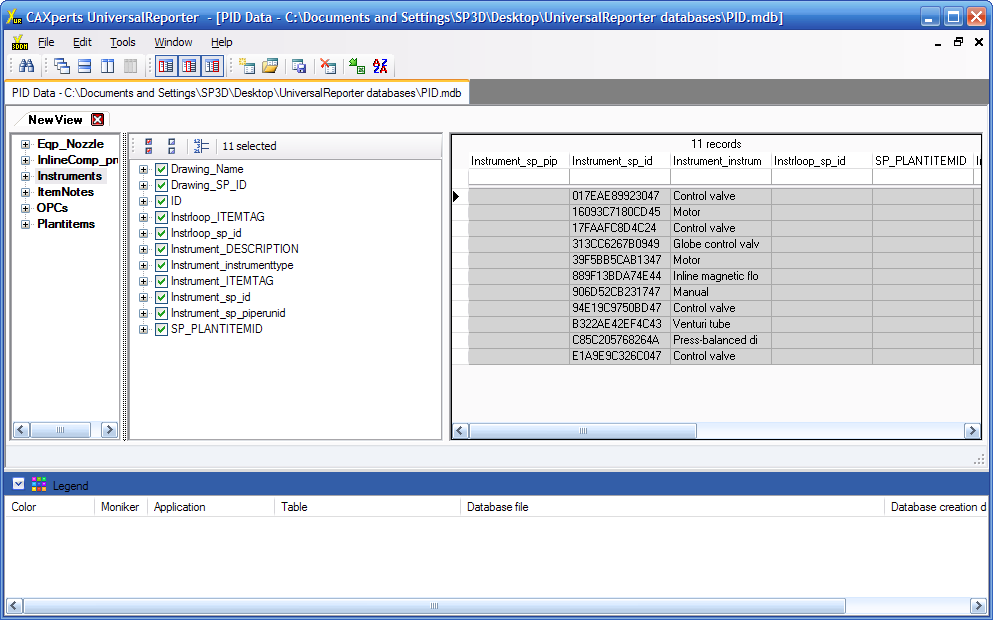
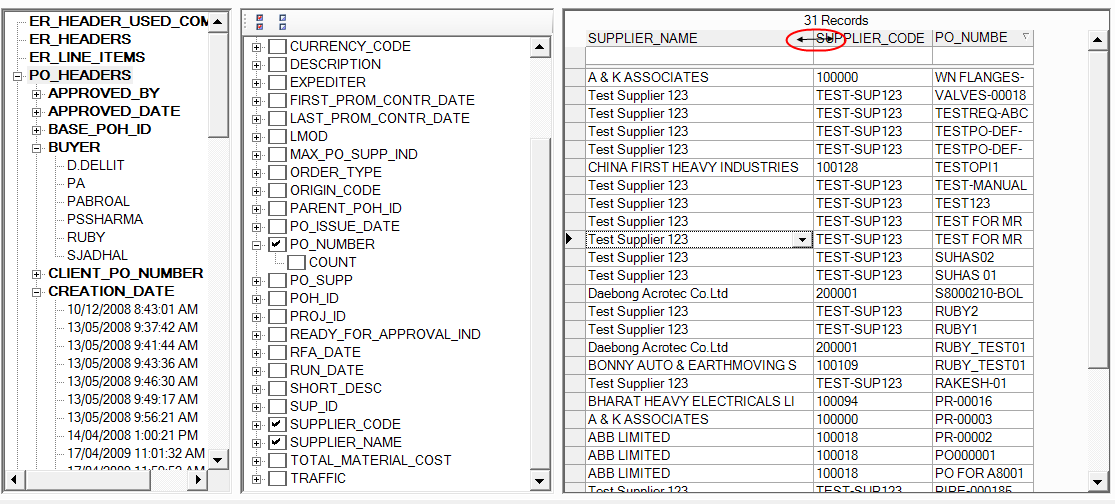
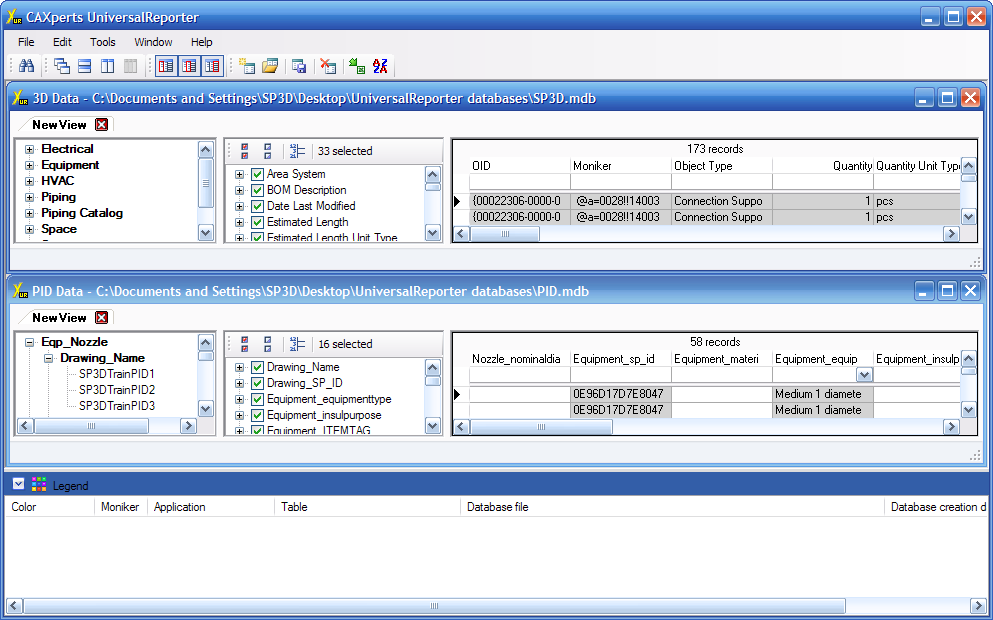
Graphical User Interface of UniversalReporter
The UniversalReporter database windows/tabs are split into three areas:
Attributes tree
Attributes panel
Data grid
), resize can be done by moving the bars between the areas (
) and/or by resizing the window.
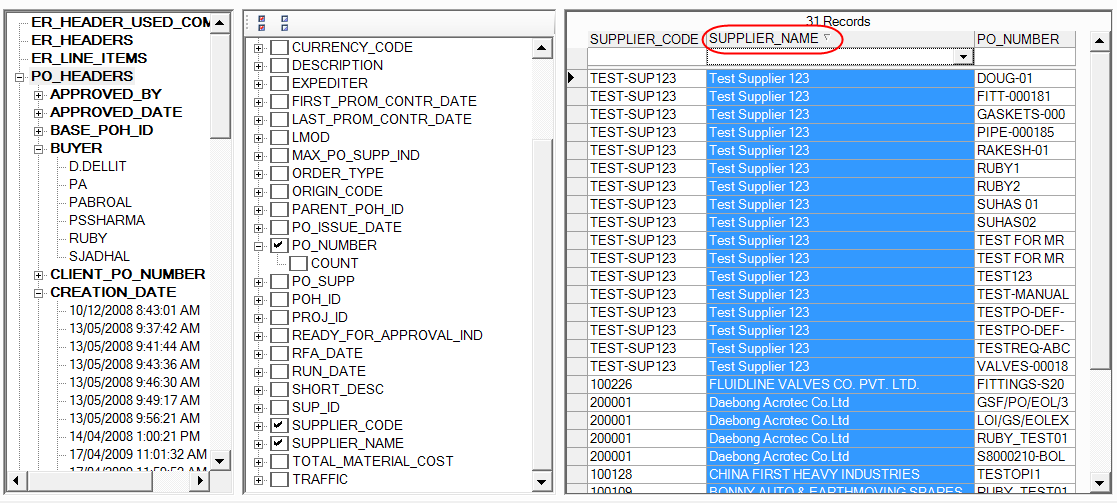
Attributes tree
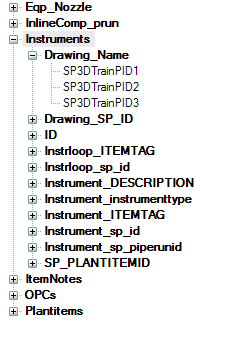
The attributes tree is a visualisation of the application database, exported with the ReportAdapter to a data (.mdb) file (refer to ReportAdapter documentation files for full details). Each node listed in the attributes tree can be a table, column or value represented in the data file or otherwise known as object, attribute and value respectively.
All nodes can be added, or removed with the context menu. Object nodes cannot be renamed. As seen in the above figure, the base nodes are always object nodes. These nodes represent each table in the data file.
The second node types visible are the attribute nodes. These nodes represent columns of selected tables in the data file. These nodes can be differentiated from the value nodes by bold text and from the object nodes by position. Unlike value nodes and object nodes, attribute nodes can be renamed (see Appendix B: context menus).
The last type of nodes listed in the figure is the value node. They represent each possible value for an attribute, and are used as a filter and grouping mechanism for a view.
Attributes panel
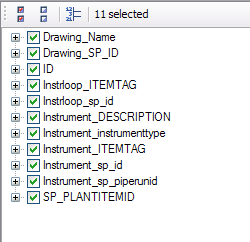
The attributes panel lists attributes of a selected object in the attributes tree (see Attributes tree). Checking or un-checking an attribute adds/removes a column to/from the data grid (see Data grid). With the buttons on top of the attribute panel all items can be checked
(![]() ) or
unchecked
(
) or
unchecked
(![]() ).
).
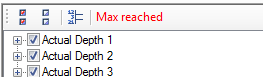
If the status of the attributes panel shows Max reached, there are too many (> 75 for windows with Edit functionality, > 120 for windows without Edit functionality) attributes selected:
The list of available attributes can be configured using the attribute manager window. (see Customising the attributes panel)
Path attributes are shown in red italics. They refer to attributes that are in the current path of the selected node in the attributes tree, and are used to group and/or filter data in the data grid. Path attributes cannot be un-checked. To uncheck the attribute it has to be deselected in the attributes tree.
When selecting attributes, you can also choose to apply operators.
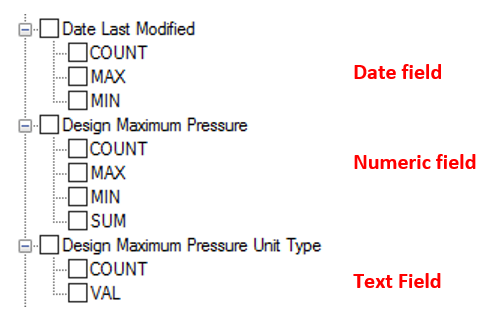
There are five operators:
MAX: calculates the maximum of all values grouped in each row in the data grid. This operation cannot be selected with its corresponding attribute.
MIN: calculates the minimum of all values grouped in each row in the data grid. This operation cannot be selected with its corresponding attribute.
SUM: calculates the sum of all values grouped in each row in the data grid. This is the only value that can be selected with its parent attribute, as it won’t create misleading results.
COUNT: displays the number of unique values of the attribute for each grouped row in the data grid. This operation cannot be selected with its corresponding attribute.
VAL: displays the numerical part of a string field
The operators that are allowed for each attribute are determined by the type of attribute.
Numeric attributes have all operators unless the attribute is contained in the path, then it only has a SUM.
Date attributes have all operators except SUM. If it is contained in the path, then no operator is possible.
Non-numeric attributes only enable COUNT and VAL operations.
Attributes with checked operator are shown in bold print. The data related to the checked operator is visible in the data grid.
Data grid
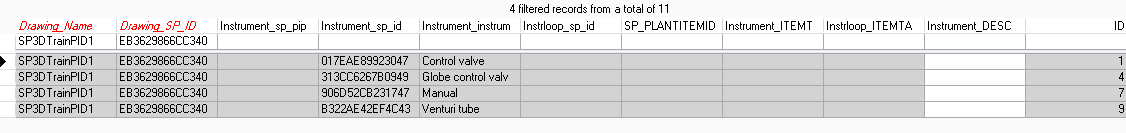
The data grid displays the data that is selected by the two other components, the attributes tree and attributes panel. All columns shown are based on selections made in the attributes panel.
The data grid has three types of columns:
The path column is shown in italics and reflects the path attribute selected. If there is a value selected in the attributes tree, the column cannot be filtered.
The operator column reflects an attribute with operator applied in the attribute panel (labelled with _(of)_).
The attribute columns reflect all other attributes selected in the attribute panel.
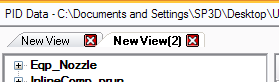
Views
Views are saved program states and are visible as tabs above the attributes tree, attributes panel and data grid.
Opening a view can be done in two ways, first, in the
File menu, and secondly with the toolbar button ( ). Multiple
views can be opened at the same time. Each view is displayed as a tab as
seen above.
). Multiple
views can be opened at the same time. Each view is displayed as a tab as
seen above.
Creating a new view can be done just as easily, this also has a menu
item in the File menu, and a toolbar button( ).
).
Closing a view is done with the same methods as listed above and
additionally with a context menu which is opened by right-clicking a
tab. The toolbar button icon is .
.
Views also have the Save ( ),
Save as, and the Save all views
function, which can be found in one or more of the above mentioned menus
or toolbars. Saving writes changes to a view into a
UniversalReporter view file (.cvf). After saving, this
file can be opened with any project of the same type of application.
),
Save as, and the Save all views
function, which can be found in one or more of the above mentioned menus
or toolbars. Saving writes changes to a view into a
UniversalReporter view file (.cvf). After saving, this
file can be opened with any project of the same type of application.
When the view is locked, i.e. already open in another session (e.g. by another user), it will be opened read-only. The lock is indicated by a red dot on the view tab. From a technical point-of-view the lock is a lock file with extension .ovf. The lock can be removed using Tools → Remove readonly from view.
Customising the attributes panel
Click on Tools → Attribute manager. The following dialogue box appears for the application of the active window.
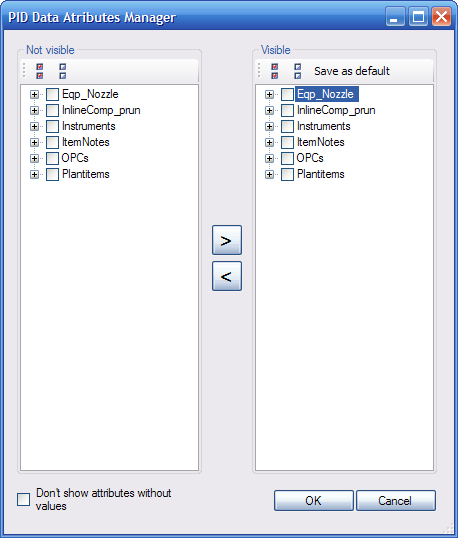
Expanding an object node will list all available attribute nodes, attribute values will be shown in the tooltip.
Select the required attributes by checking the preceding checkbox.
Press the Add button
(![]() ) to add
the selected nodes to the Visible panel. Click on the
(
) to add
the selected nodes to the Visible panel. Click on the
(![]() ) button
to remove selected attributes from the left tree, after selecting
them.
) button
to remove selected attributes from the left tree, after selecting
them.
Press the OK button to apply the changes. The Don’t show attributes without values check box enables or disables attributes under all object nodes which have no values in the database (looking for empty values will take some time).
The attributes newly added will at once be visible in attributes panel but won’t be visible straight away on the attributes tree. If required, use context menu or equivalent toolbar button to add attributes to the attributes tree.
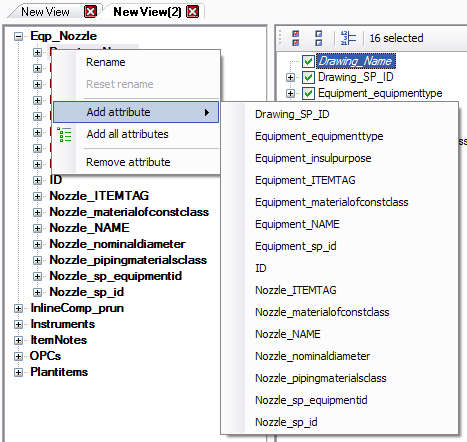
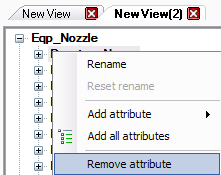
To remove attributes for the purpose of clearness, select Remove attribute from the context menu of the desired attribute node. Removing an attribute can also be done by dragging it to its object node.
Customising attributes names (glossary function)
The system permits the user to setup a glossary for attribute nodes. Each application can be setup to use its own glossary by changing the glossary path in the settings window (see Settings). There can be multiple sets of glossary entries.
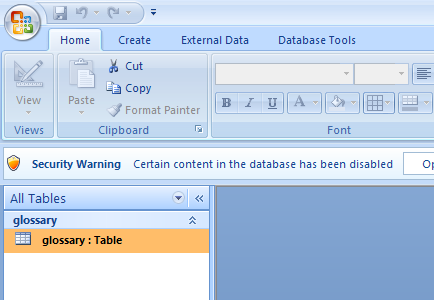
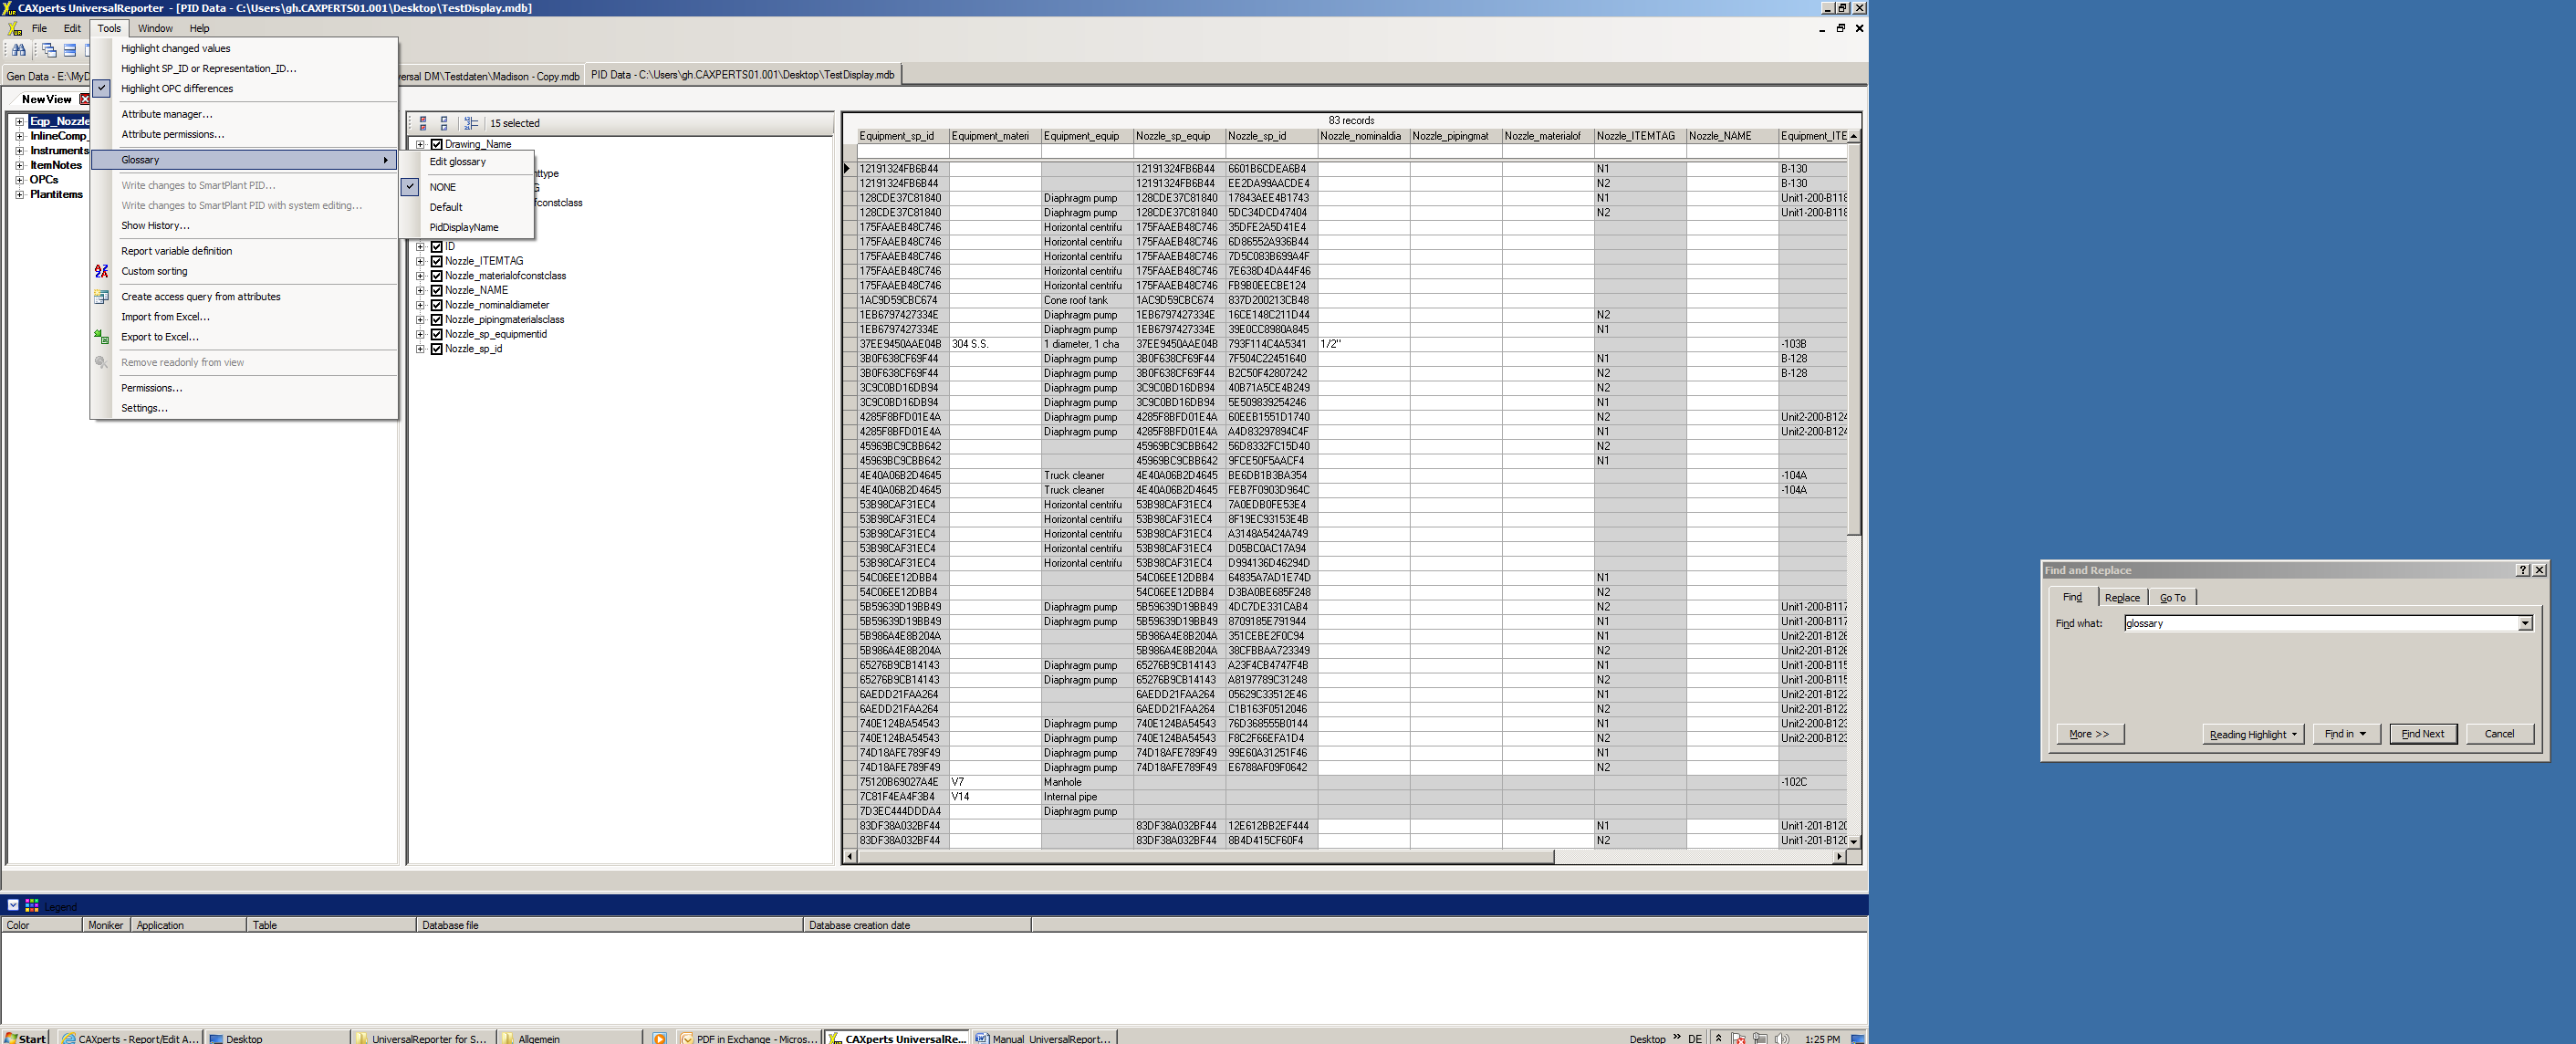
From main menu, select Tools → Glossary → Edit glossary. This will open the glossary table in Microsoft® Access.
Double click on the glossary table. There are two root columns in this table. The Table_Name, and the Column_Name. Each column being self-explanatory. Each additional column defines a glossary entry. The Default column is the first entry listed. Every additional column will add another glossary entry.
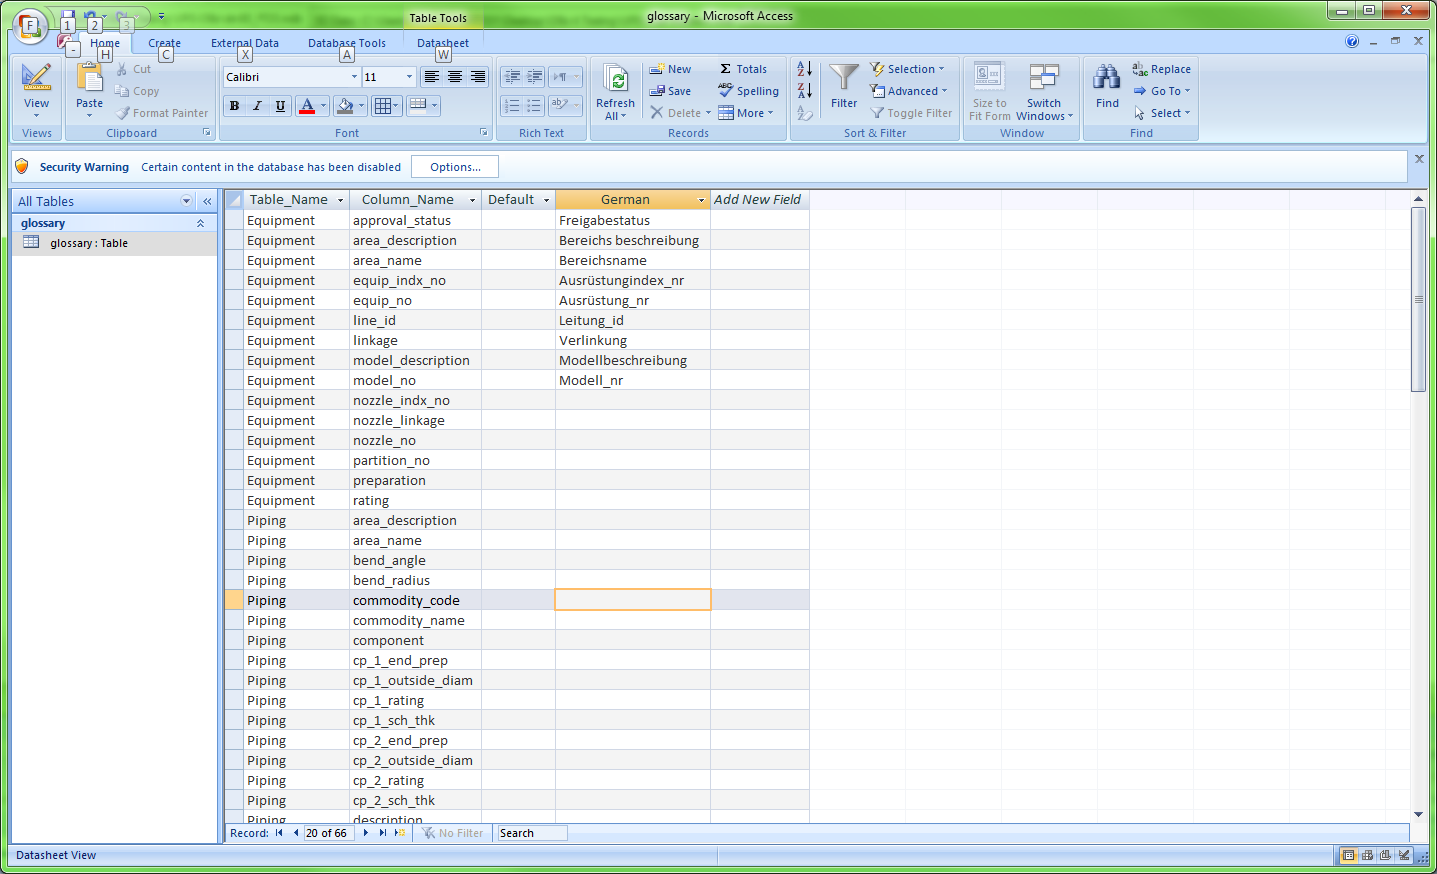
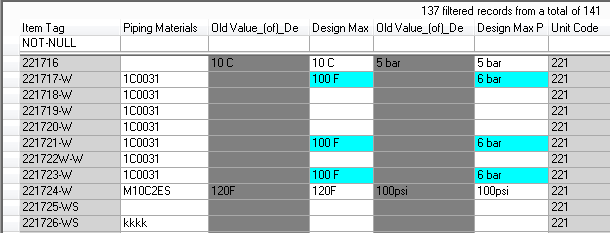
The table above shows an example of a glossary entry with the name "German".
Then close Microsoft® Access.
In UniversalReporter, if system glossary (‘NONE’) is selected you will see the original attribute names.
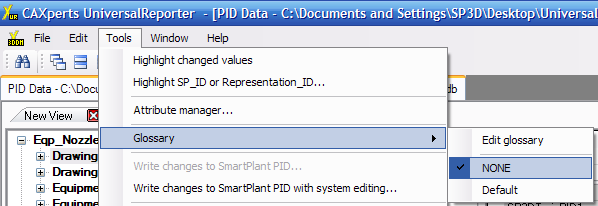
To switch glossary select Tools → Glossary → #The Glossary you created#. See example below:
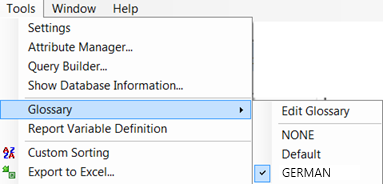
Selecting German, you will see the attribute names as translated in this glossary.
Some ReportAdapters (e.g. ReportAdapter for SmartPlant P&ID, SmartPlant Instrumentation and SmartPlant Electrical) provide the attribute names together with the display names. In these cases the glossary includes an additional column with the display names (e.g. PidDisplayName, InstDisplayName, ElDisplayName).
This additional column is created/updated automatically whenever a database, which contains display names, is loaded.
Filtering and sorting views
Arranging the views is essential to the UniversalReporter. In order to keep the process simple, all actions can be done with a mouse. The following chapters will help you to set up each view part by part. All changes listed here are saved to a view file (.cvf) when saving the view.
Filter and grouping functionality
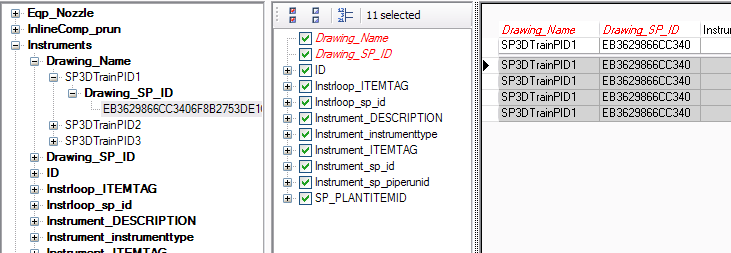
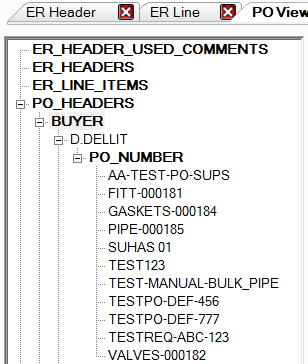
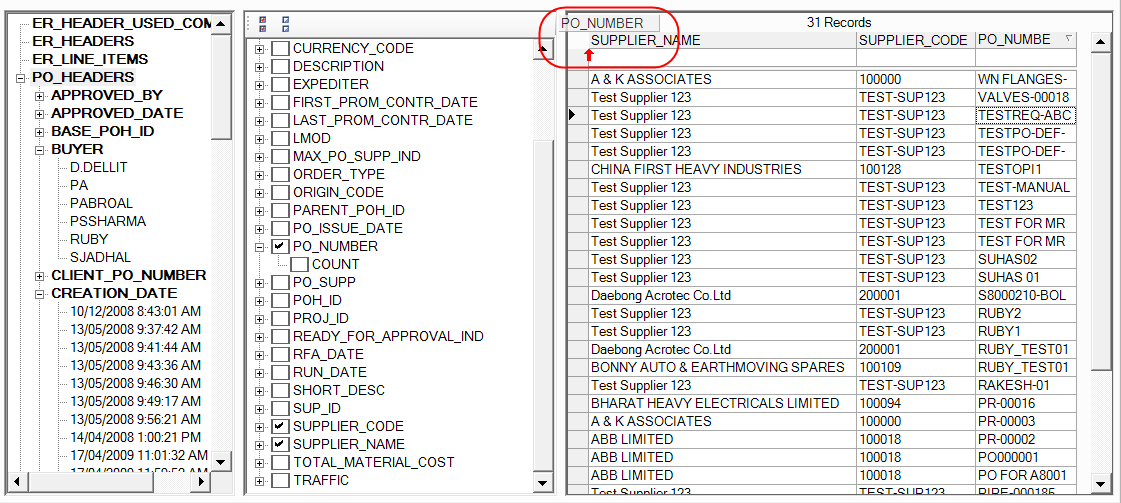
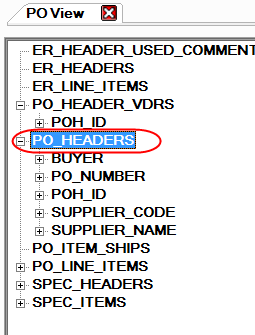
The attributes tree can be used to filter attribute and value. For this purpose the desired attribute nodes may be nested. For example, if you wish to know for a particular buyer, what were the PO_NUMBERs created by him/her, follow the steps below:
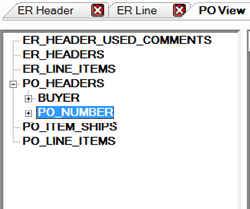
Add the object [PO_HEADERS] to the attributes tree.
Add the attribute [BUYER] and [PO_NUMBER] to the object in the attributes tree.
Grab and drag the PO_NUMBER node and drop this on the BUYER node.
Expand the BUYER node then select a buyer. Expand this value and you will see the PO_NUMBER node nested within this buyer.
Expand the PO_NUMBER node under the select buyer and you will see all PO_NUMBERs created by this buyer.
This process can be repeated recursively until the desired granularity has been reached.
Search in attributes tree
To search the attributes tree, select Search in attributes tree on the Edit menu.
This standard search window will show up:
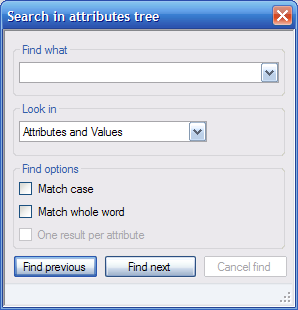
Option One result per attribute is only available if Attributes is selected for field Look in. Checking/unchecking this option leads to different results only if the grouping functionality of the attributes tree is used (see Filter and grouping functionality). If the option is checked the search will show the matching name of nested attributes only once.
Data grid customising and filter functions
Within the data grid, columns can be sorted, moved, filtered or resized.
Sorting
Click the column header to sort the row ascending and once more in descending order.
Custom sorting
Custom sorting permits multilevel sorting to be applied.
In the attributes tree, ensure you have selected the object node required and the relevant columns are visible on the data grid.
Click on the Custom sort icon. The following dialogue
appears:
icon. The following dialogue
appears:
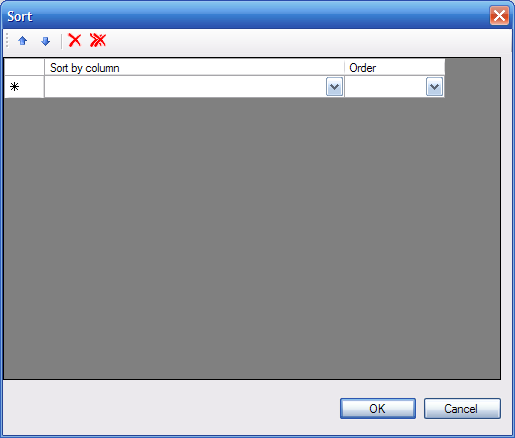
Add the first level of sorting required.
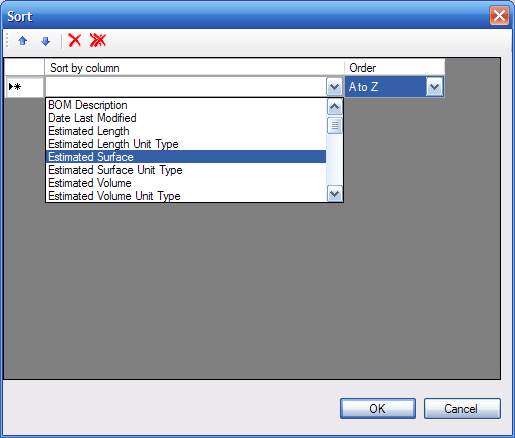
Add the second level, third level, etc. To reorder the sorting, use
the arrow icons. To remove a level of sorting, use the
Delete icon. Use Clear
 icon to remove custom
sorting. Click OK when complete. System will apply custom sort to the
data grid.
icon to remove custom
sorting. Click OK when complete. System will apply custom sort to the
data grid.
Reordering/moving
Grab and drag the column you want to move and drop it to its new location (marked by a red arrow).
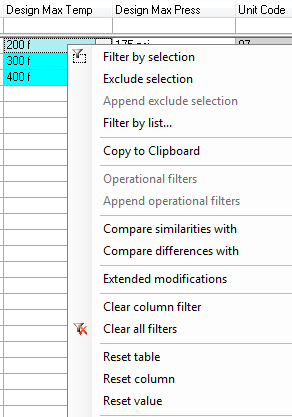
Filtering
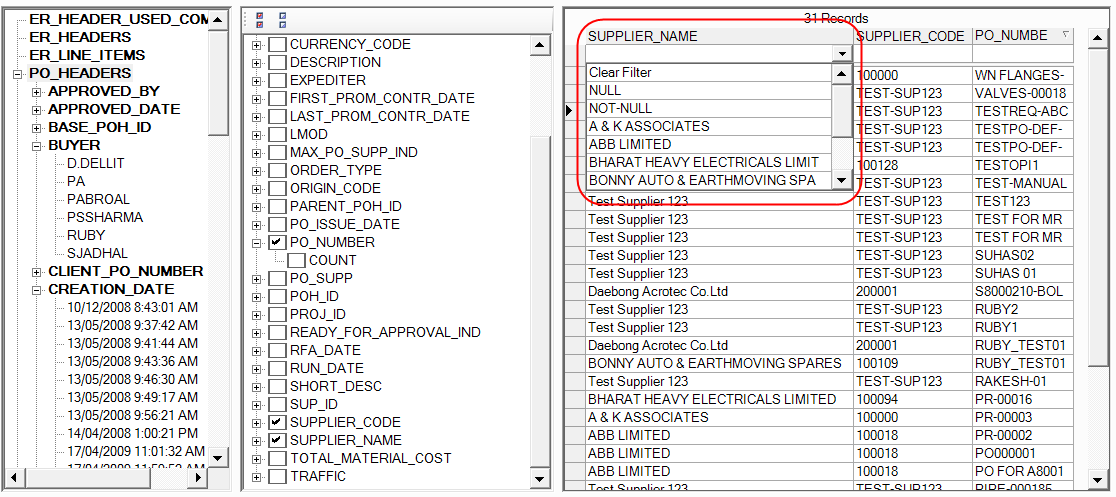
The NULL value will filter for all empty values in the column, while the NOT-NULL does the opposite.
It is also possible to filter manually by typing into the filter field. Possible operators while manually filtering include “<”, “>”, “<=”, “>=”, “<>”, “*” or “%”. It is also possible to use the “&&” (AND) and the "||" (OR) conjunction to place multiple filters for the same column.
Filter by list
The above window displays the Filter by list option, which allows selecting multiple values to filter with using the [ctrl] button on clicking, or by dragging the mouse over multiple values. This option can be found in the context menu of the column which is to be filtered.
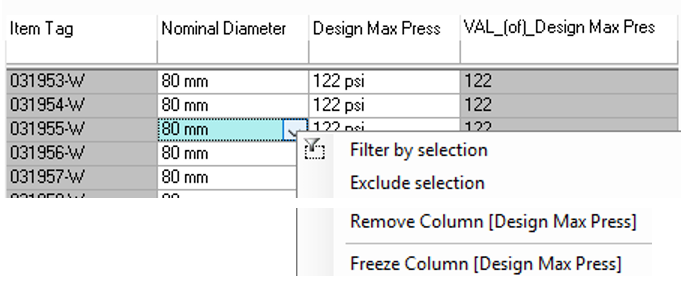
Filter by selection
Use the context menu item Filter by selection to filter all items so that only items with the selected value will be shown.
Exclude selection
Use the context menu item Exclude selection to filter all items so that only items without the selected value will be shown.
Append exclude selection
Use the context menu item Append exclude selection to remove all items with the selected value from the current filter.
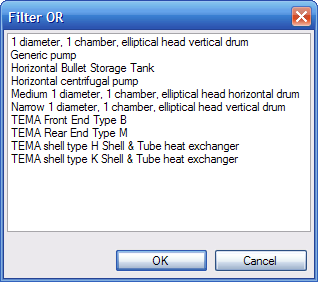
Filter multiple columns
If filters are set to more than one column then these filters by default are applied as “AND” filters which means that all criteria have to be fulfilled.
To change this behaviour, use the toggle button AND/OR to switch between this “AND” mode and an “OR” mode where the column filters are applied in a way that all rows where the data match at least one of the filters are displayed.
Resizing
It is possible to resize each column in the data grid as seen below. There are two possibilities to do this.
The first possibility is to drag the space between columns to the right in order to increase the size, and to the left in order to decrease the size. Dragging must be done at the header level of the grid. See above diagram.
There is also the possibility to auto size each column to the largest value. This is done by simply double clicking the space between the columns.
Removing Columns
It is possible to remove a column with Right Mouse / Remove column on the data in the selected column. It is also possible to remove a range of columns by selecting a range of columns and then selecting Right Mouse / Remove Columns
Freezing Columns
It is possible to freeze a column with Right Mouse / Freeze column on the data in the selected column.
Reporting
Exporting to Microsoft Excel
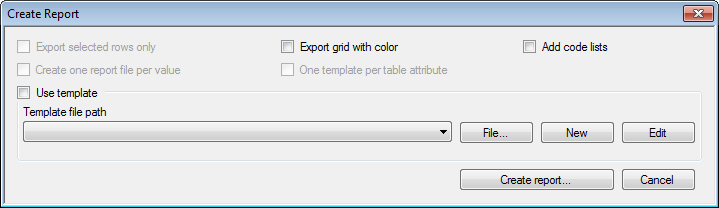
Export selected rows only is only available, if rows are selected in the data grid. To select a row, click on its header. Use Shift and Ctrl keys to select more than one row. The report will then be created for the selected rows only.
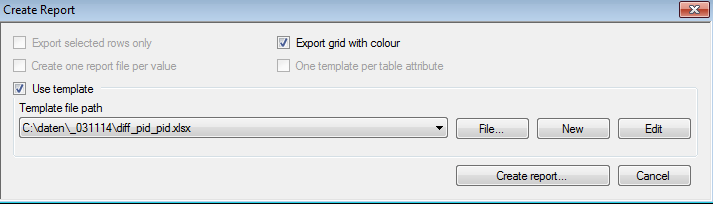
Export grid with colour creates an Excel report directly from the data grid, where cells are coloured like in grid. If this option is selected, no template can be used.
Create multi report based on key attribute: is only available, if a value was selected in the attribute tree. The system has the ability for creating multiple sheets of different reports in one file, for a selected value of a key attribute. The report template then has to contain multiple template sheets which all share this key attribute (see Creating multiple sheets report associated to a value).
Create one file per... (e.g. Create one file per 'Spec Name') is only available, if an attribute (e.g. spec name) or a value within this attribute was selected in the attribute tree. Using this option, for every value of the selected attribute a new report file will be created (e.g. a separate file will be created for every Spec Name) see also Creating a file per attribute value.
Add code lists (PID and 3D only): With this option selected an additional sheet (CodeLists) will be added to the Excel report, which contains all code list values for the extracted attributes. In the report sheets, the code listed attributes refer to this additional sheet such that the code list values can be selected from a drop down field for changing the data.
Template-free export to Excel
The most direct method is to export data to Excel without using a template. The steps are:
Ensure you are on the data grid which you want to export. Click on Export to Excel (
 ) or use
menu Tools -> Export to
Excel.
) or use
menu Tools -> Export to
Excel.Ensure the checkbox Use a template is not ticked then click on the Create report button.
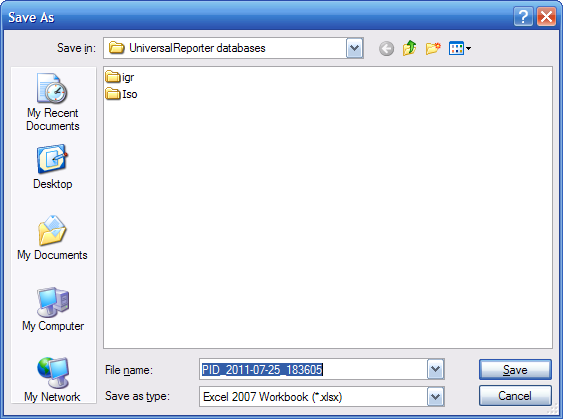
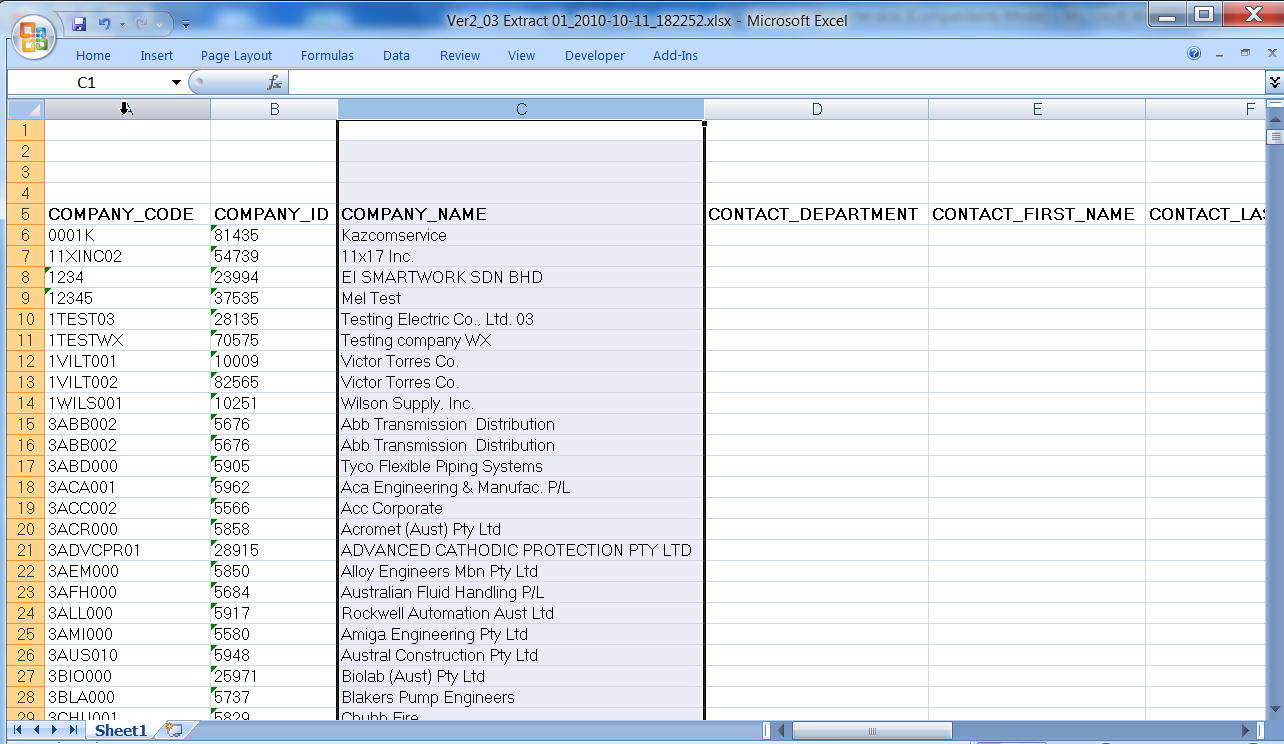
- Decide name and location where you wish to save the export file. Click Save.
The system will then generate a report and display the following dialogue box.
Click Yes to display the Excel report.
Export to Excel using a template
The steps to create an Excel report using a template are:
Ensure you are on the data grid which you want to export. Click on
the Export to Excel () toolbar
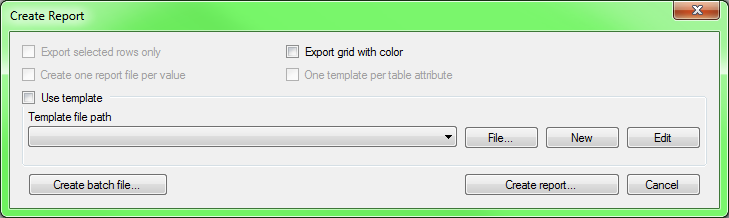
button. The following dialogue window will appear.
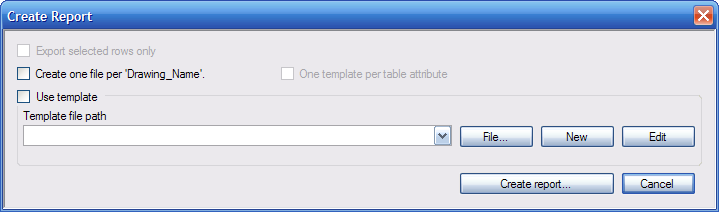
You have several options to obtain the template file you need:
Use the Template file path combo box showing the templates used before; select your template if it is available from the drop down list.
If the file is not available on the drop down list and you want to use an existing template, click on the File button. A dialogue box will appear. Locate the template and click Open.
If you want to create a new template, click on the New button. A dialogue box will appear. Enter the filename required and click Save.
To open a template for editing: For the first two options click the Edit button. For the third option, the system will automatically open the template for editing when you click Save.
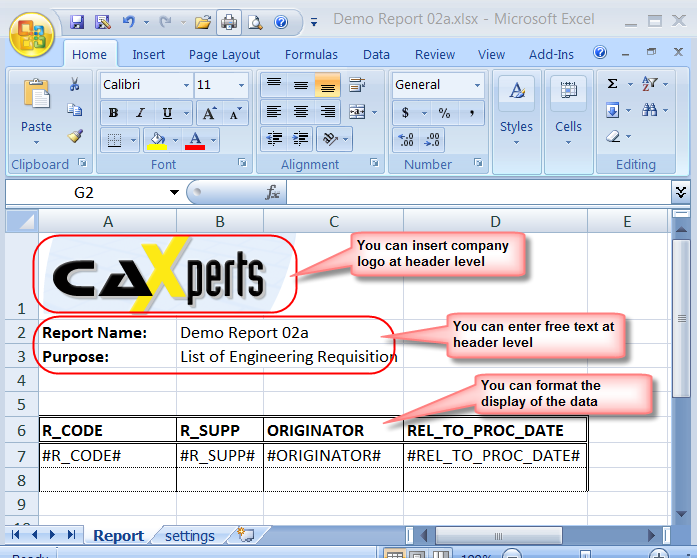
The standard template looks somewhat like the sample shown below.
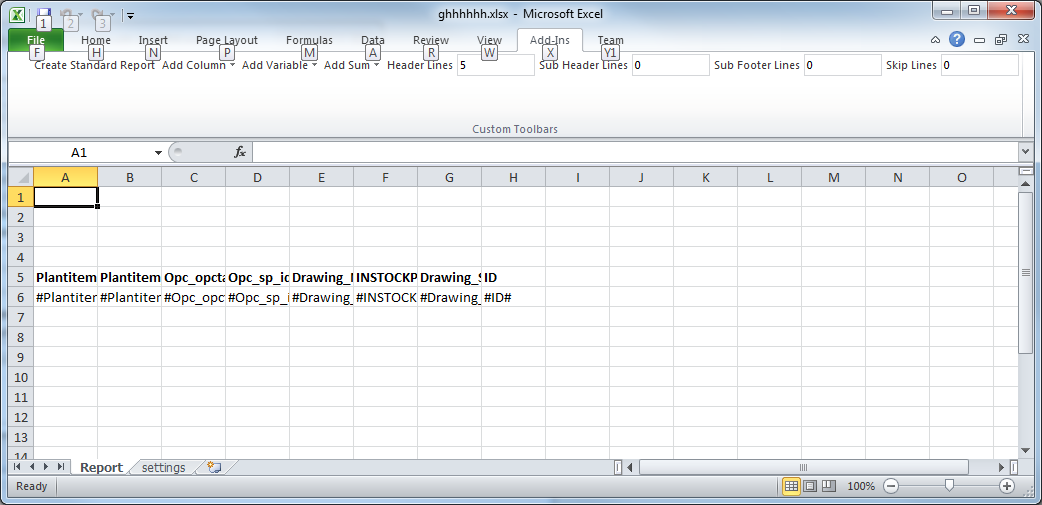
The following options/settings are available on the add-in:
Create standard report: apply the header and skip lines setting, and rebuild the sheet.
Add column: insert a column marker for the selected column in the cell currently selected. The displayed columns are those available in UniversalReporter.
Add variable: insert a report variable from list of values. (see below)
Add sum: inserts a summed value to the report. Currently only values which are recognized as numbers in the database are listed. Depending on wherer a sum field is placed sum types can change. See Creating reports with sub header, sub footer and sub total).
Header lines: insert the number of rows that should be above the column markers to add header information.
Sub header lines: insert the number of rows where sub header text and attributes should be defined. (see Creating reports with sub header, sub footer and sub total, see also the Lab UniversalReporterSuite 3D on the Help menu).
Sub footer lines: (see Creating reports with sub header, sub footer and sub total).
Skip lines between rows: inserts the given number of empty rows between each line(s) with data.
Additionally it is possible to insert pictures (i.e. your company logo), text and/or text formatting into the header rows. See sample below.
Export to Excel using report variables
You can add a report variable to the template. First you must create this variable in UniversalReporter. To do this:
- From main menu, select Tools → Report variable definition. This will open the Report variable definition dialogue box.
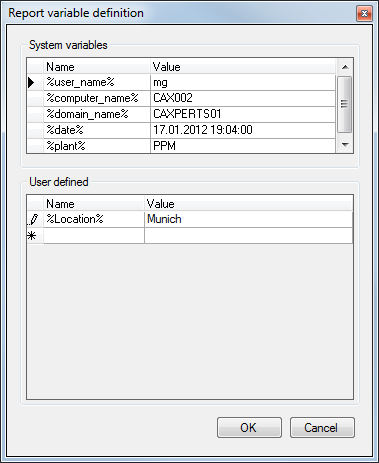
The top part of the variable definition form displays system and plan specific variables which are read from the system or the database of the current active data window. These are not editable.
The user defined section displays the variables that are defined per user, and can be edited. By entering the name and value of the variable in the Name and Value fields respectively.
Now you can add the field to your template. See below:
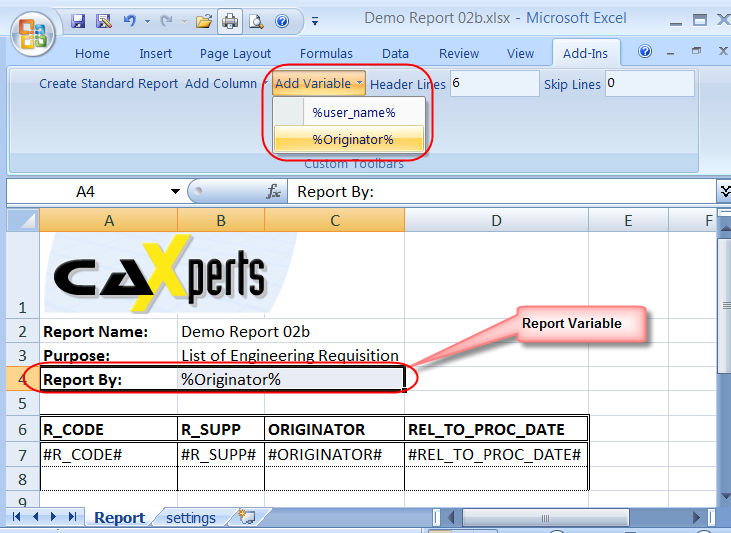
Variable “Asbuilt-name”
For PID data (assuming the PID ReportAdapter version is at least 3.2.0.39) in the case or projects located underneath an As-Built plant the variable Asbuilt-name is available for reporting.

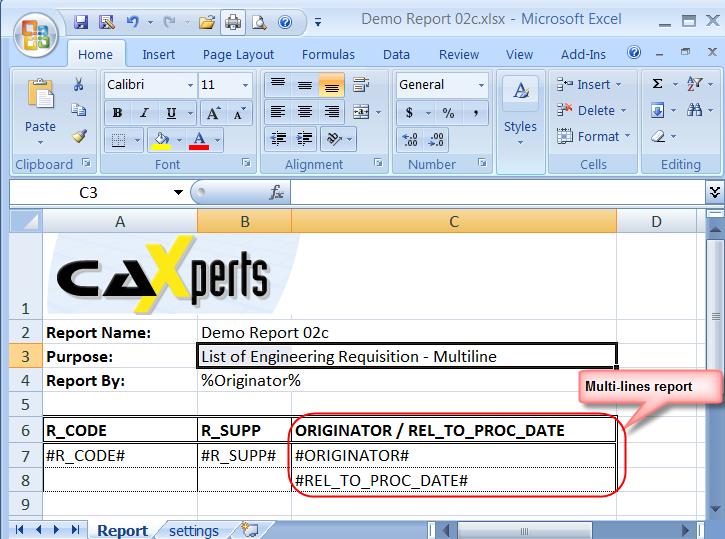
Creating multiline report
By simply spreading the column marker across more than one line a multi-lined report is created.
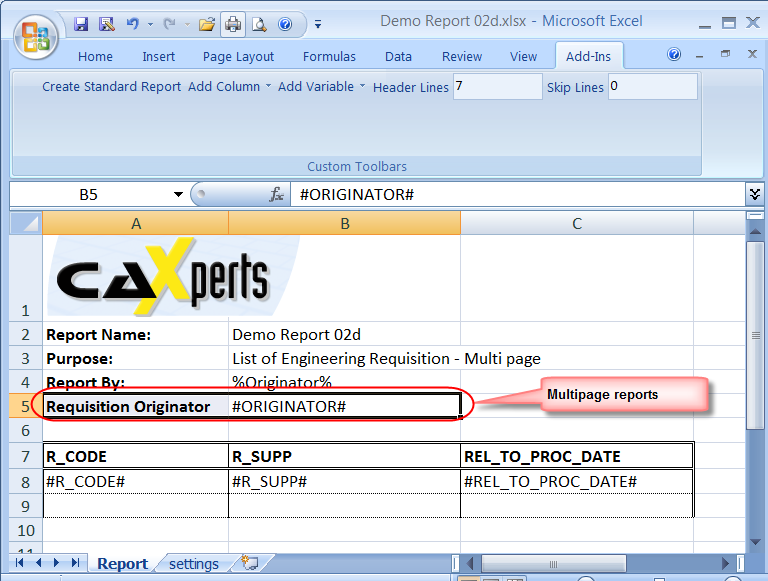
Creating multipage report
It is also possible to create multipage reports. This is achieved by placing one or more column markers within the header area. Placing for example #Originator# into the header area will create one sheet for each different originator.
Close and save the template when you have finished.
The Create report dialogue will be displayed again.
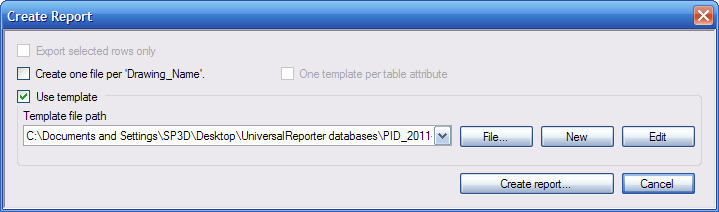
Ensure the Use a template check box has been ticked, click Create report button to generate the report.
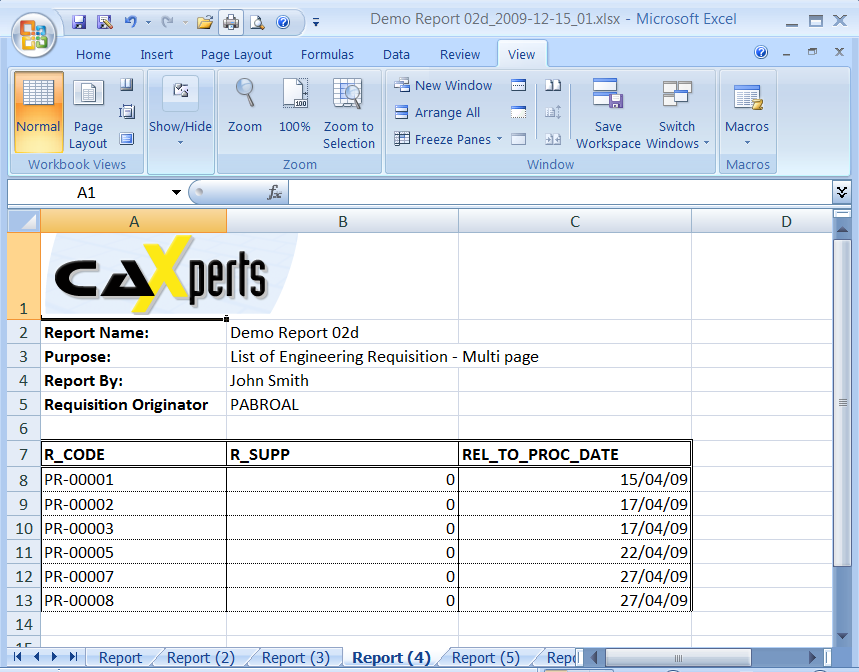
Below is the finished report utilising multipage. In this case each sheet represents the originator name.
Creating reports with header and footer
There are two possible header and footer types. The first are report headers and footers. Report headers and footers are added directly to the report, using the template header rows configuration in the add-ins toolbar. This header type is visible on each sheet in the report, but not on each page. The same pertains to the footer. The amount of rows added to the footer does not need to be defined, since it is simply calculated by designating everything below the last data row. Entering a “#” value into the footer may result in strange effects, though it is possible to add a sum field into both the header and footer to receive the total value of that column.
The second possible header and footer are those that are defined by the Excel pages. It is possible to use the Excel predefined values in these fields (i.e. page number, date, etc.) as well as UniversalReporter variables, both user and predefined (“%” fields).
The above picture displays the usage of a standard template with the excel page header and footer using the variables %plantname% and %date% in the header, and %user% in the footer.
Creating reports with sub header, sub footer and sub totals
In addition to Report headers and footers, it is possible to add sub headers and sub footers. Both are defined by adding the number of rows into the add-ins toolbar. The sub header rows are counted directly after the header rows end, and the sub footer rows start directly after the last data row (rows with “#” fields).
The sub header row is used to create a master-detail-report by including a data field (“#”) in the sub header rows; the report will sort the following data rows to match the values in the sub header as seen in the following example.
The sub footer rows cannot contain any data fields but can contain variable and sum fields. Sum fields in the sub footer rows calculate different from sum fields elsewhere, the total of the area between the last sub header and sub footer instead of the whole total of the data field.
Even though sum fields are predefined in the add-ins toolbar, these values only display fields that are recognized by the database as a number, in which case some attributes may be numbers as well but not listed in the dropdown in the toolbar.
It is still possible to sum these fields even if they are not in the dropdown, by manually adding the field name (original and not display name) between two “|” symbols. Additionally numbers which contain units of measurement and other strings can also be totalled.
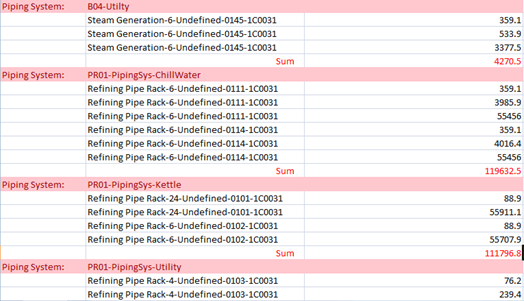
The above picture shows a report in which piping system is used as a sub header, and the estimated length of each pipe run of that piping system is totalled.
Creating multiple sheets report associated with a value
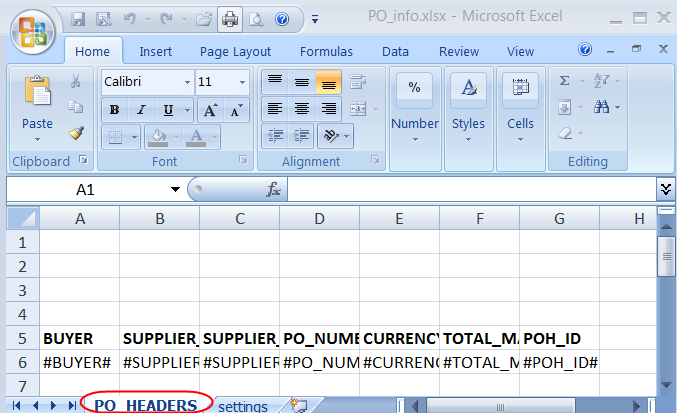
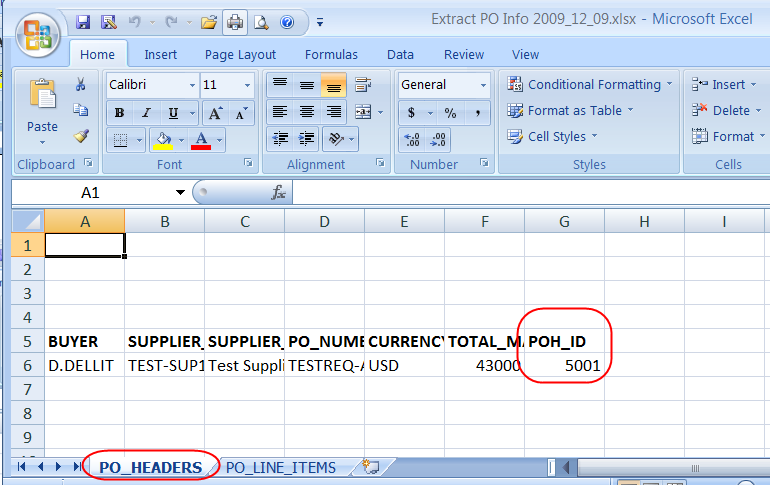
The system has the ability for creating multiple sheets of different reports for a single value selected. First you have to set-up a template, which has the value as the key parameter, e.g.to create a report which lists PO_HEADERS on the first sheet and with PO_LINE_ITEMS as the second sheet. The steps are:
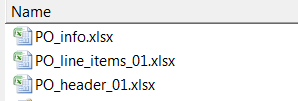
Create a template report for table PO_HEADERS as per normal (see Exporting to Excel). Give the template a unique filename say PO_header_01.xlsx.
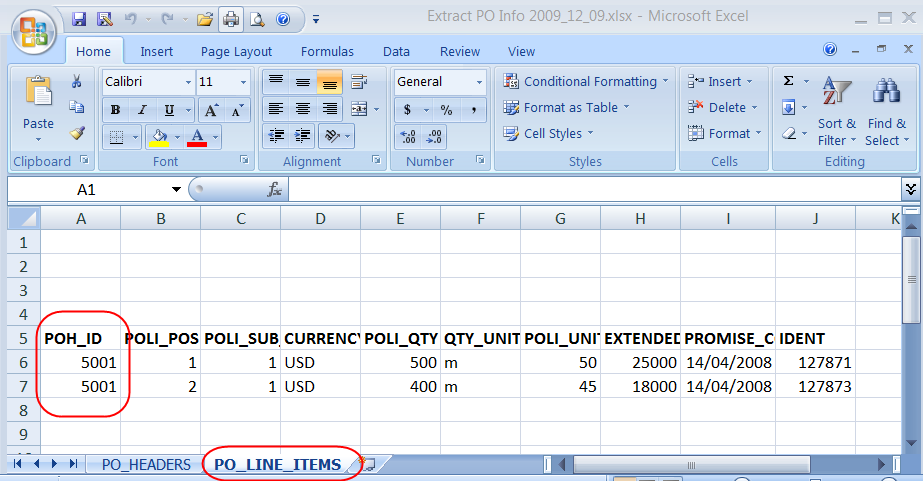
Similarly create another template report for table PO_LINE_ITEMS as per normal. Give the template a unique filename say PO_line_items_01.xlsx.
Now combine these two worksheets into one Excel template. To combine, copy PO_header_01.xlsx to another Excel File, say PO_info.xlsx.
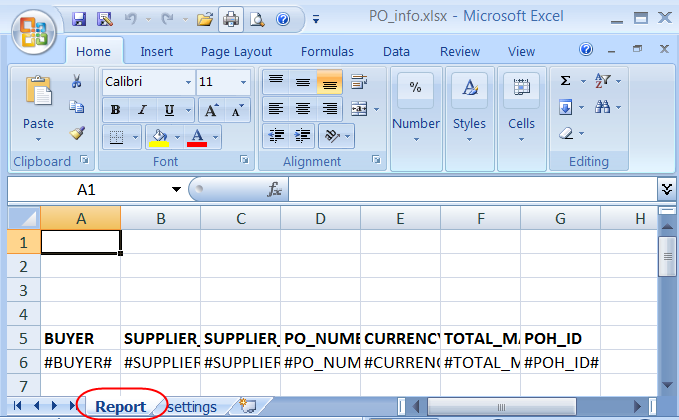
Open PO_info.xlsx. Rename the sheet name from “Report” to the object name which this template was generated with, in this case it will be “PO_HEADERS”.
Copy the second worksheet from PO_line_items_01.xlsx into PO_info.xlsx.
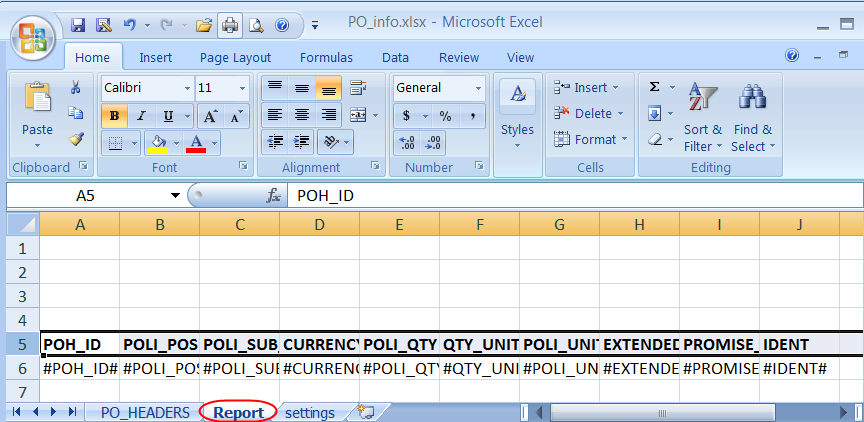
Rename the sheet name from “Report” to the object name it was originally created for, in this case it will be “PO_LINE_ITEMS”.
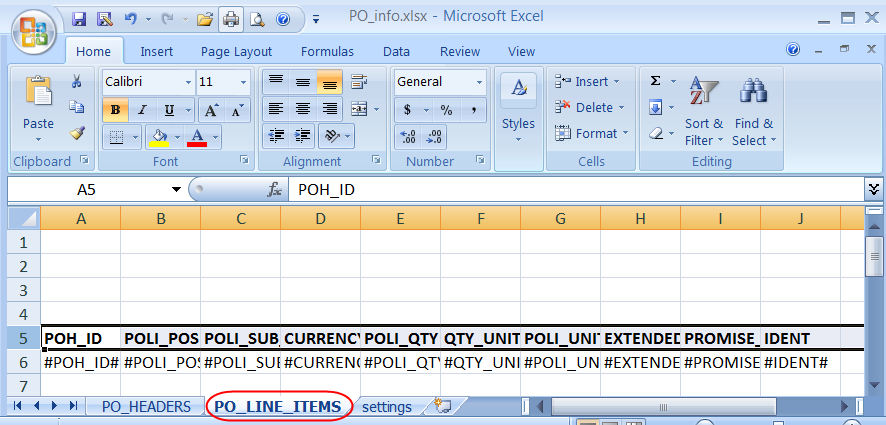
Save and Close the updated template report.
Return to UniversalReporter.
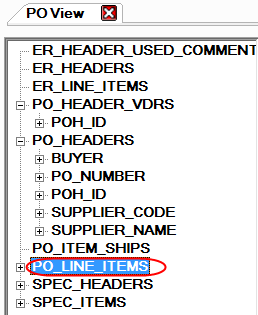
In the Tree filter, for the object PO_HEADERS,
select a value for the attribute POH_ID. Say we select POH_ID = “5001”.
Click on the Export to Excel () button.
The Create report dialogue will appear.
Locate the template required. Tick the One template per table attribute checkbox and the Use a template checkbox .Click Create report. The system will ask you to save the output file and after the report was created if you like to review the output file. All data related to POH_ID = “5001” will be reported to the multiple sheets.
Creating a file per attribute value
The system can create a file for each value of a selected attribute, e.g.:
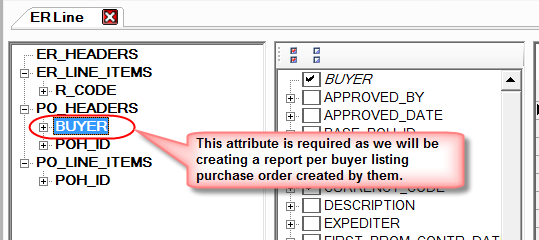
The objective is to create a report for each buyer listing their purchase orders.
First, in the tree filter grid, under PO_HEADERS object, you will need to add the attribute BUYER.
In the attributes panel, select the fields you need
in your report. Check the data in the data grid filter,
with the attribute BUYER selected in the tree, click on
the Export to Excel icon.
icon.
Ensure the check boxes “Create one file per ‘BUYER’” and “Use a template” are ticked and a template is selected.
Click Create report button to generate multiple files. Select a folder to which the multiple files shall be saved. The program will open this folder after the reports were created. The BUYER values are added to the respective report file names.
The resulting Excel files should look like this:
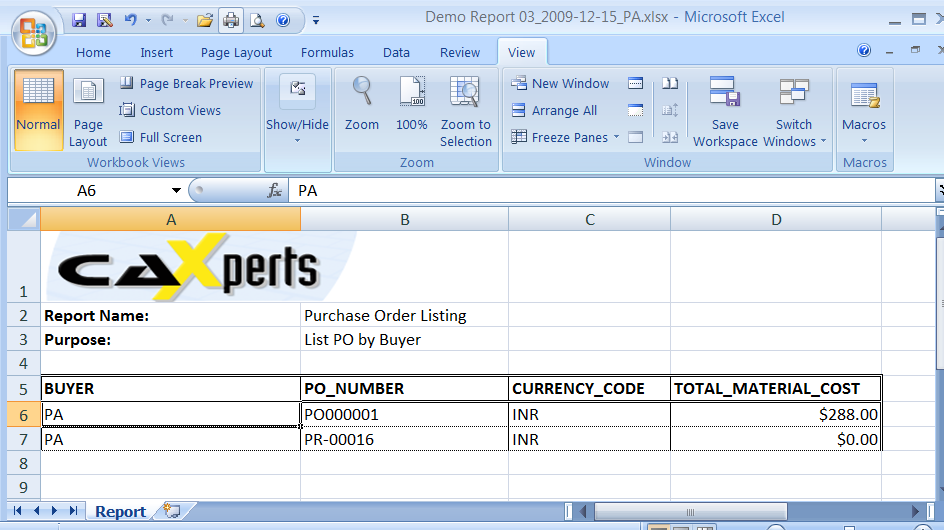
Sample report for BUYER “PA”
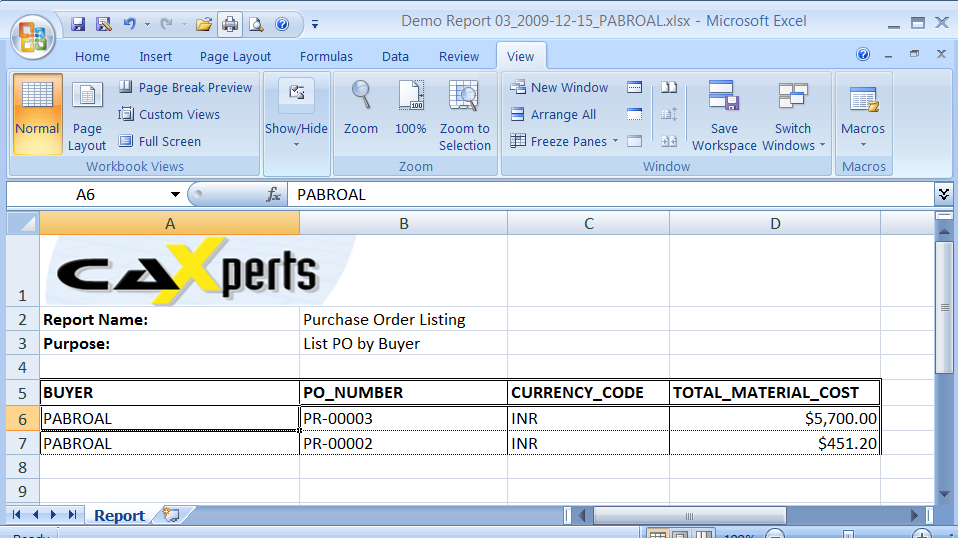
Sample report for BUYER “PABROAL”
Creating template with Excel function
You can also include Excel functions within a template which you create. For example, you can Concatenate fields, use the If function, mathematical functions etc. in the template.
Report generation using URB files
UniversalReporter can be used from the command line to automate the Excel report creation.
Prior to usage, the report which needs to be run in batch mode needs to be configured and saved as a UniversalReporter batch file (.urb). This can be done in the Create report window.
Clicking the Create batch file button will open a new window in which two fields need to be filled.
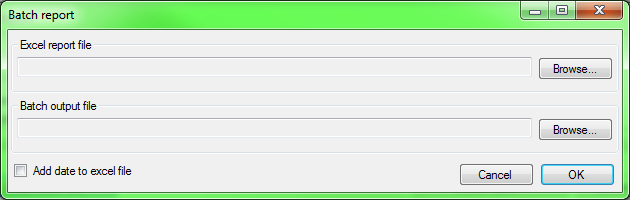
The Excel report file defines the destination for the resulting report Excel file. The file name can automatically be modified with the date at the end (i.e. c:\ReportFile.xlsx becomes c:\ReportFile_2012_01_01.xlsx) when the Add date to Excel file option is checked.
The Batch output file path defines the destination and file name of the resulting UniversalReporter batch file (.urb) which contains all the information which is needed in order to create the report in command line mode.
Using the resulting urb file it is possible to create a report in the command line mode as follows:
C:\> “C:\Program Files\CAXperts\UniversalReporter\UniversalReporter.exe” [Path to urb file]
The batch file resulting report is then created at the location defined in the urb file.
Options (like Use template) selected in the Create report window while creating the urb file are stored there and will be applied in batch mode.
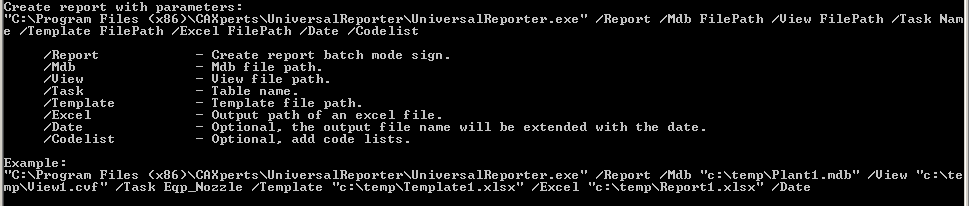
Reporting in command line mode with parameters
UniversalReporter can be used from the command line to automate the Excel report creation.
These parameters are available via command line:
Multi-application windows
(not available in ApplicationReporter)
Opening multiple projects simultaneously
You can open multiple projects from different applications simultaneously if you have the UniversalReporter licence.
Open a project from one application. Click on File → Open project or Recent projects and choose the database you want to open.
Similarly, open the second project from the same or another application by repeating this step. This time choose a different database. Repeat this for additional databases.
Use the windows icons ( ) to organise your projects on
the screen.
) to organise your projects on
the screen.
For example, tile the windows horizontally by using the  Tile windows
horizontally icon.
Tile windows
horizontally icon.
Links for multi-application windows
To activate the multi-application windows, a link for the two objects to be joined must be available in the Links configurator.
Links
In general, links work by associating two attributes together. These attributes can come from any of the supported applications and can be grouped for more complex joins. Links also allow for concatenated attributes or SQL functions, meaning that even custom naming rules can be associated across applications.
Valid application acronyms are:
PID for SmartPlant® P&ID applications
Ins for SmartPlant® Instrumentation applications
El for SmartPlant® Electrical applications
PDS for PDS® applications
3D for SmartPlant® 3D applications
Mat for SmartPlant® Materials applications
Xls for Microsoft® Excel applications
PDMS for PDMS applications
Gen mdb files not resulting from a Report Adapter
The links can be defined between the same applications (e.g. to compare different versions of a project) or between different applications. The following is an example for a simple link between equipment from P&ID and 3D:
| Link_Name | Application1 | Table1 | Attribute1 | Application2 | Table2 | Attribute2 |
|---|---|---|---|---|---|---|
| Equipment | PID | Eqp_Nozzle | Equipment_ITEMTAG | 3D | Equipment | Equipment Name |
In the above example the P&ID Eqp_Nozzle table will be linked to the 3D equipment table only where the ItemTag in P&ID matches the EquipmentName in 3D.
Each attribute used for linking is identified by its application, table name, and attribute name.
The 'Link_Name' column is an identifier that is used both as a display name when creating multi-windows inside the UniversalReporter software as well as a 'group name' when creating more complex joins. It should be descriptive and must be unique to the set of attributes.
The following example (based on the previous example) shows a more complex link using multiple entries:
| Link_Name | Application1 | Table1 | Attribute1 | Application2 | Table2 | Attribute2 |
|---|---|---|---|---|---|---|
| NozzleList | PID | Eqp_Nozzle | Equipment_ITEMTAG | 3D | Equipment | Equipment Name |
| NozzleList | PID | Eqp_Nozzle | Nozzle_ITEMTAG | 3D | Equipment | Nozzle Name |
In the above example the two applications will be linked both on matching equipment names and matching nozzle names. In this way more complicated links can be built up to meet additional requirements.
The final example shows the use of concatenated attributes:
| Link_Name | Application1 | Table1 | Attribute1 | Application2 | Table2 | Auttribute2 |
| PippeLines | PID | InlineComp_prun | [Piperun_operfluidcode] & "-" & [Piperun_tagsequenceno] | 3D | Piping | Pipeline System |
In the above example the pipeline tables are being linked from P&ID to 3D. In the example 3D is also using a custom naming rule that needs to be matched in P&ID.
The syntax used for concatenating multiple attributes follows the standard Microsoft Access rules:
All attribute names must be enclosed in '[]' square brackets.
All separator characters must be enclosed in '""' quotation marks.
The '&' symbol is used as the concatenation operator.
Links configurator
The links configurator is a tool to display, create, delete and edit the links. It can be opened by clicking the Tools -> Links configurator menu entry.
To display an existing link select a link name from the links configurator toolbar.
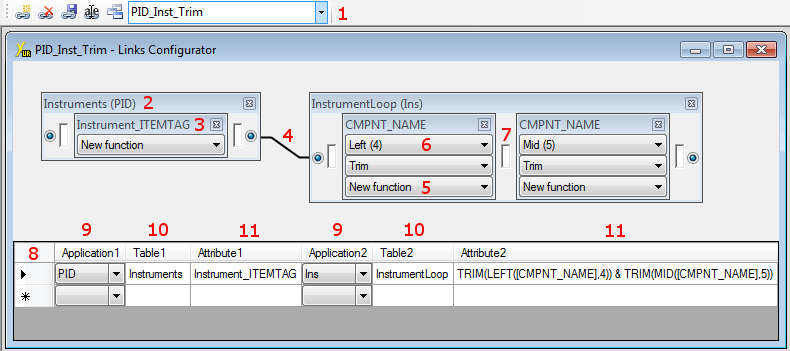
The meaning of the fields is as follows:
The links configurator toolbar
Table containing all attributes used for the link definition
Attribute (or multiple attributes) used for the link definition
Connection between two tables
Drop down list for additional SQL functions to be executed with > attribute values
SQL function (e.g. Left) showing its parameters in brackets
Field for text to be concatenated with the attribute (as prefix or > suffix) or for text between two concatenated attributes.
This grid shows all links for the selected link name.
These columns show the associated applications
These columns show the associated table names
These columns contain either a single attribute name or a more > complex SQL statement that defines the link. The whole cell will > be coloured if there is a problem to interpret the expression. > This occurs either on syntax errors or missing capability to > display it correctly (see Create new links).
SQL Functions
For link definitions with complex SQL statements you can choose between a set of predefined functions:
Trim: Removes leading and trailing blanks
Upper: Changes all characters to upper case
Lower: Changes all characters to lower case
There also exists a set of functions that requires some parameters to be set:
Left: Uses only the first n characters.
Right: Uses only the last n characters.
Mid: Uses all characters beginning at the p position. Optional you can also specify the maximum length to be used.
Every time you add a new function that requires parameters, a new window will be opened where you can configure these attributes.
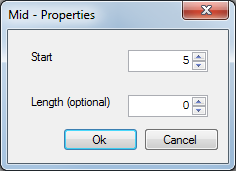
Optional parameters will be omitted, as long as their value is either 0 for numbers or empty for strings.
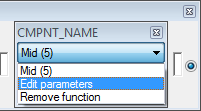
You can also change these parameters if you choose Edit parameters in the function drop down list.
Connections
Connections between two tables are displayed as direct line between them.
Create them by dragging one connection point to the other:
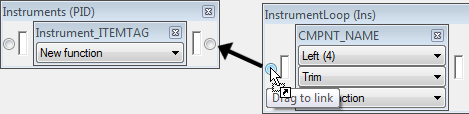
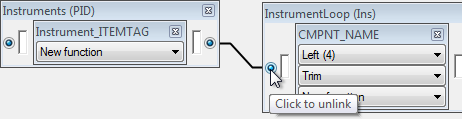
Remove them by clicking on the connection point:
Create a new link
To create a new link select ( )
New link from the Links configurator toolbar and enter
a link name. The Links configurator window will open.
)
New link from the Links configurator toolbar and enter
a link name. The Links configurator window will open.
Take the attributes needed for the link from the respective application window. This is done by selecting the needed attribute from the attributes tree and dragging it to the Links configurator window. If a second attribute is needed to define one link expression then drag the additional attribute directly on the first one. Both attributes then will be displayed in one box and will be concatenated in the link expression.
In the links configurator always the original attribute names are used. For renamed attributes (when a glossary is used), the name displayed in the tree can be different from the name displayed in the links configurator.
After selecting the attributes, add predefined SQL functions if needed and define the connection like described above. The first row of the link then will be displayed in the grid.
If an additional row is need for the link then repeat the steps described before.
However, in this case the modified cell will be coloured to show that he expression cannot be interpreted by the Links configurator and the graphical display will disappear.
With ( )
Save link the new link will be saved to the links.mdb
file which by default can be found in the database folder of the
program.
)
Save link the new link will be saved to the links.mdb
file which by default can be found in the database folder of the
program.
Creating multi-application windows with two applications
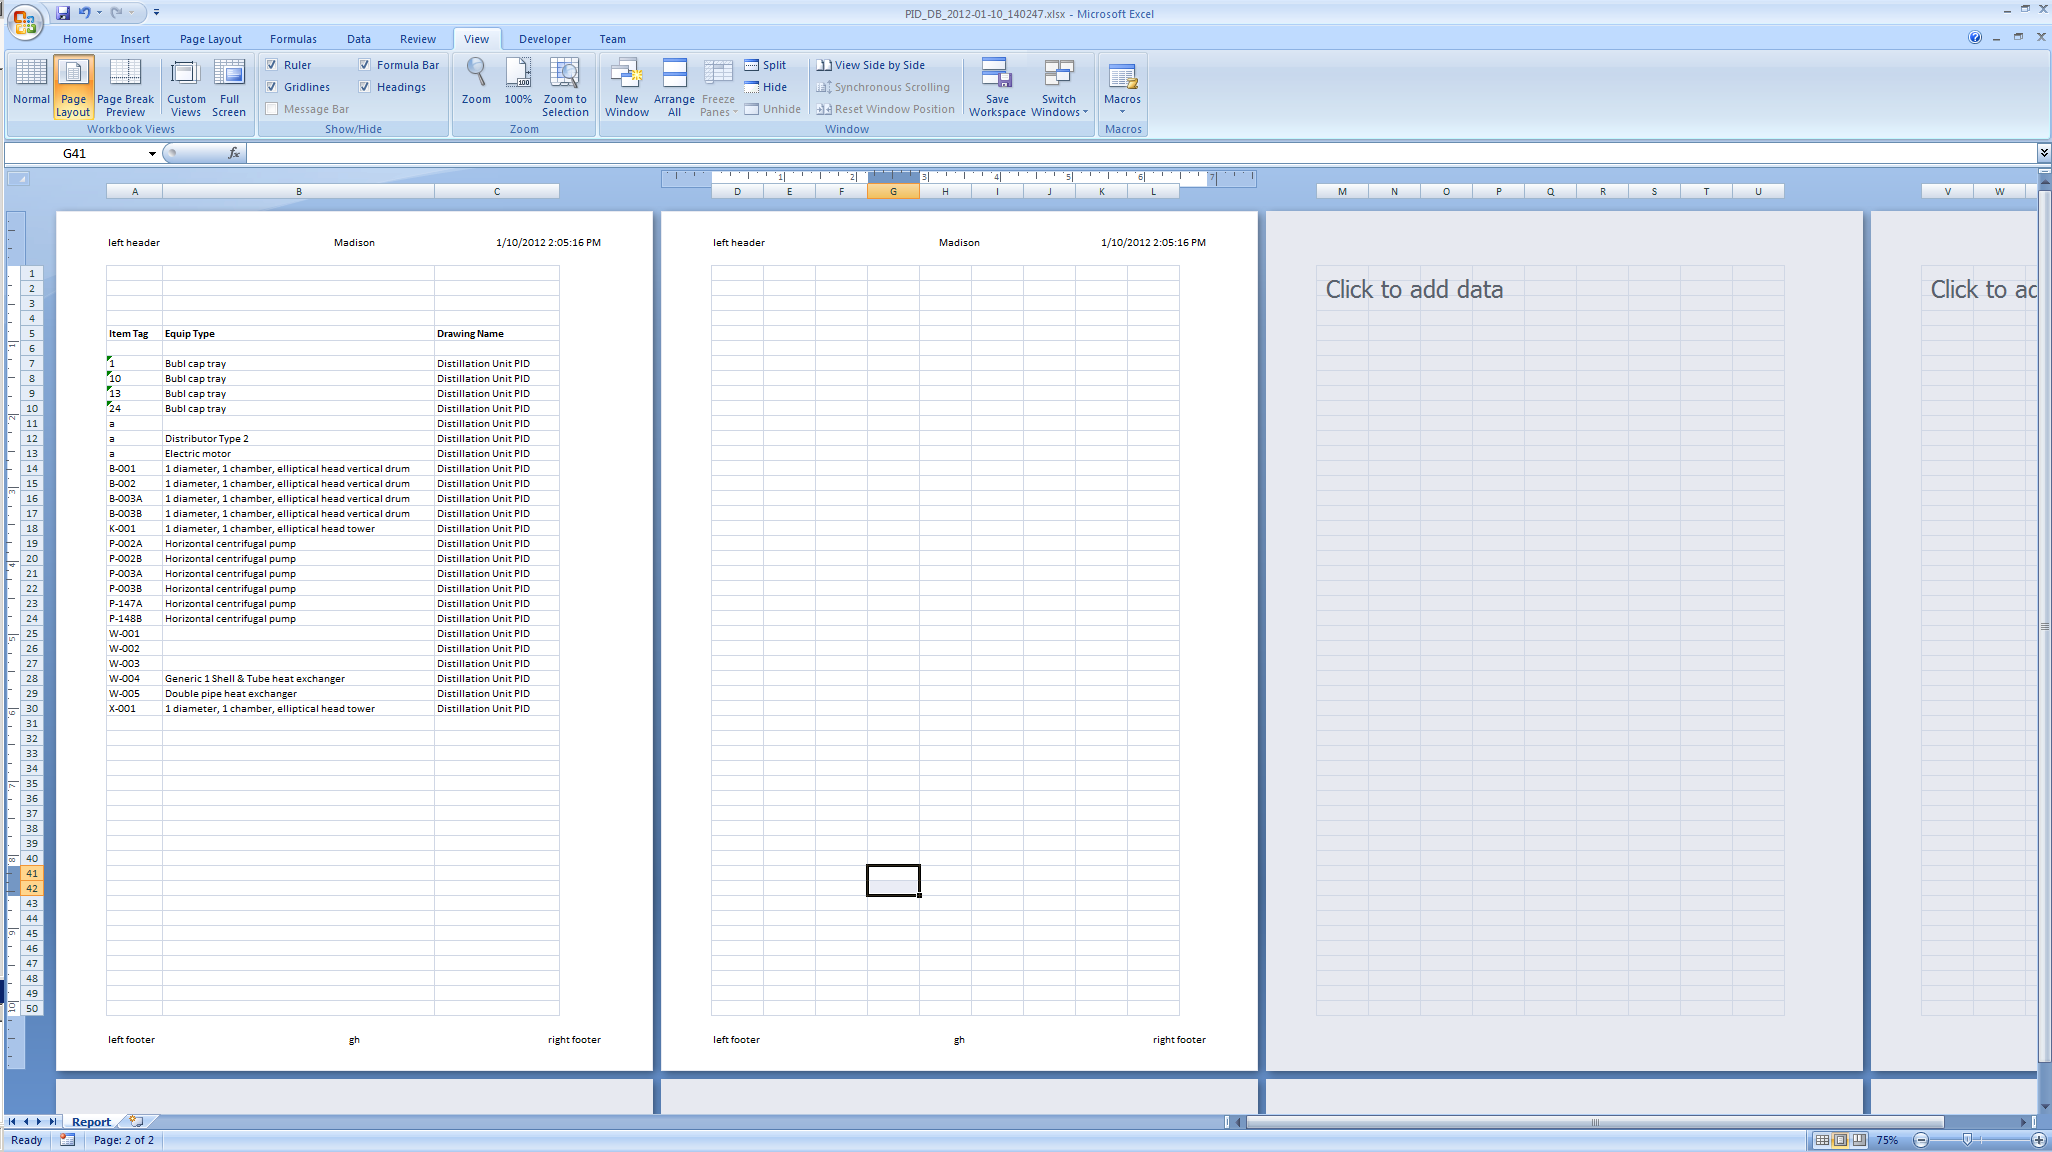
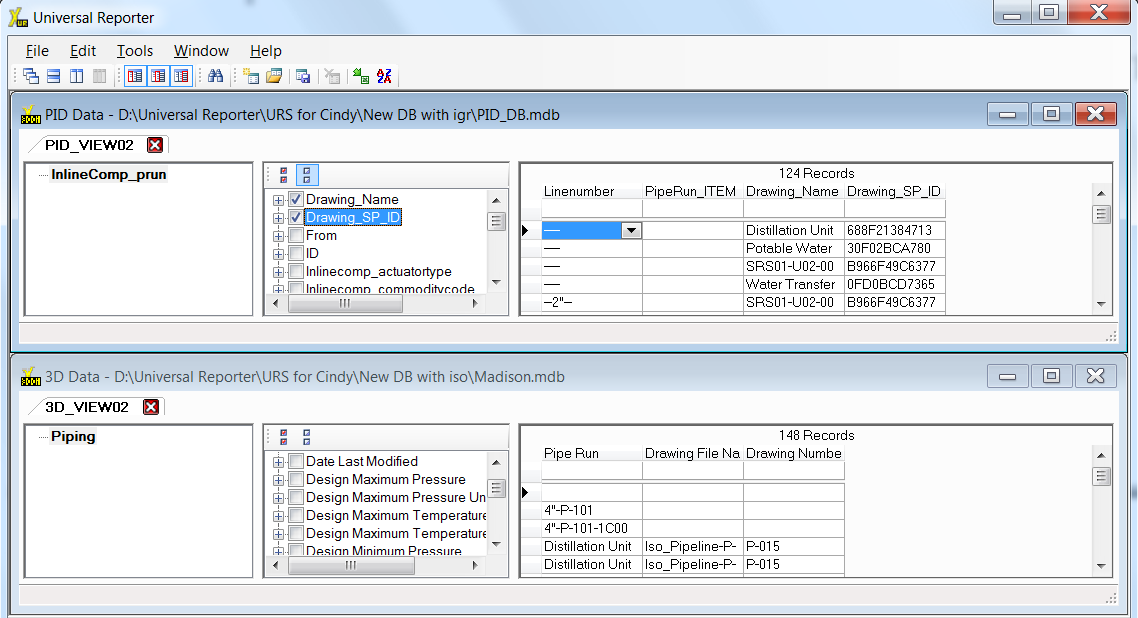
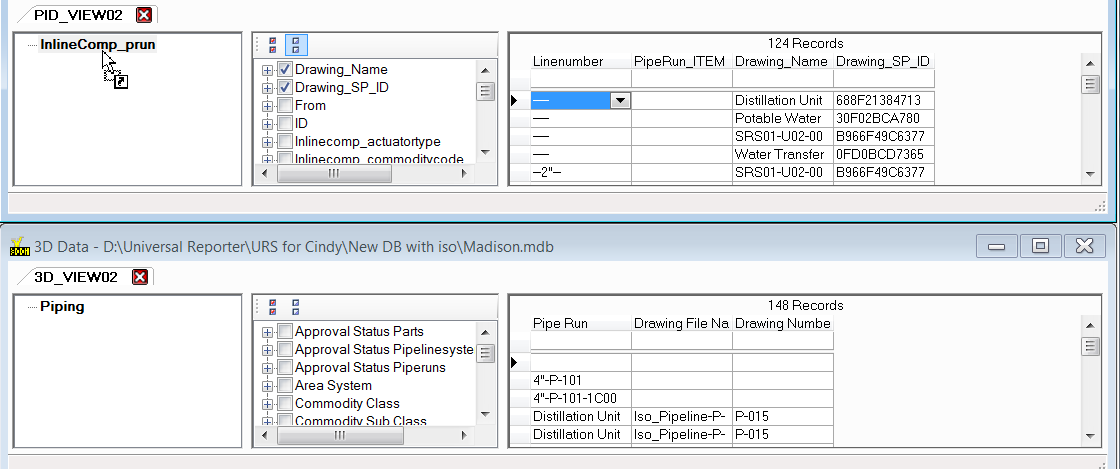
Open a project from one application – e.g.PID_DB.MDB for Smartplant P&ID. Open a project from another application – e.g.Madison.mdb for SmartPlant3D.
Tile the windows e.g. using the
![]() Tile windows horizontally icon.
Tile windows horizontally icon.
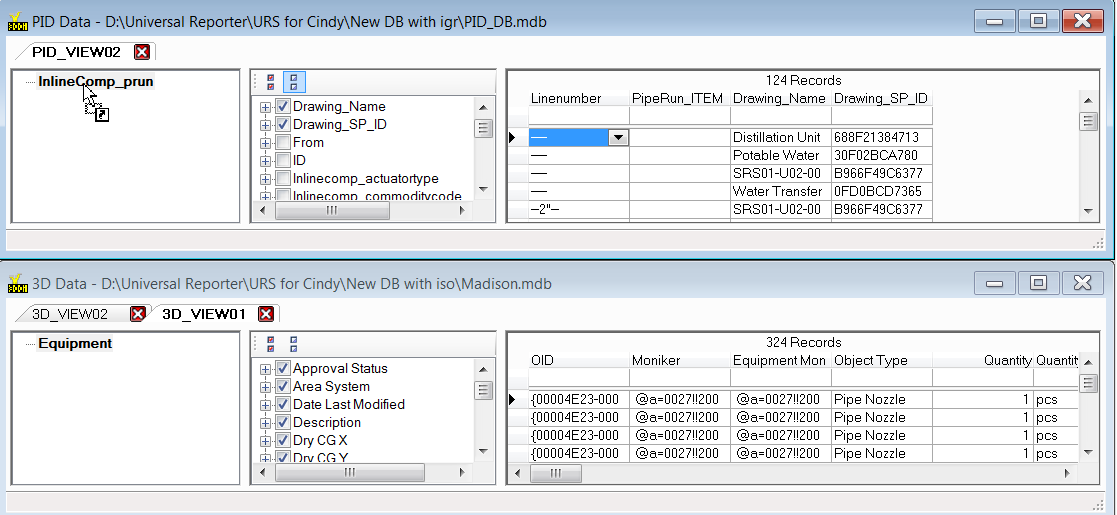
Drag an object from one project to another object on the other project.
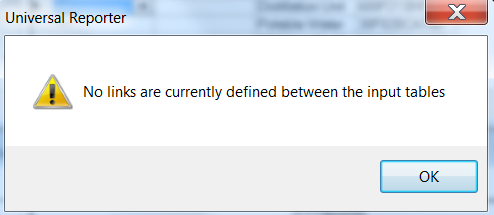
If the object link is not available in the link.mdb file, the following error will occur.
However if link is available, the following will appear. For example try to link [Piping] object to [InlineComp_Prun] Object:

From this window the user can decide to combine the data so that both datasets are displayed next to each other in the MultiWindow or to create the Comparison (Rule) Window which will show the differences between the original windows based on the link attribute and based on attributes having the same name or on attributes mapped to each other.
Combine data will create the MultiWindow.
Show differences will create the ComparisonWindow
In the Link selection dialogue box, choose the link you wish to establish from the Available links field. You can view the link information using the Show link information button.
The link information shows which attributes on the first application will be mapped to which attributes on the second application.
Also select the Join criteria required.
The Keep grouping functionality influences the number of data rows that will appear in the multi-application window. If rows are grouped in the data grid of the parent windows, it depends on this function whether data will be ungrouped or not, before being linked to create the multi-application window.
If 2 PID snapshots are compared then the monikers will be called PID1, PID2 etc.
The Keep grouping checkbox is disabled if the selected link requires attributes that are not selected in the attribute panels of the parent windows or if further applications have been added to a multi-application window.
Result of “Combine data” :
For renamed attributes, the names are taken from the parent windows. Glossaries for multi-application windows are generated temporarily. This means that attributes can be renamed there but the name is only kept as long as the multi-application window is open.
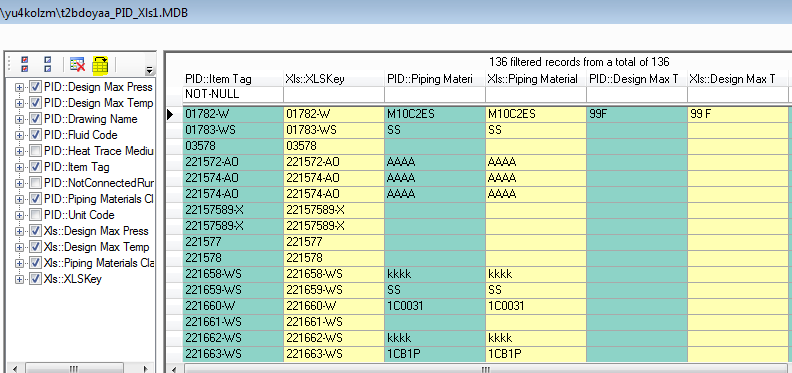
A button called “Match Columns by Name” is available: it will arrange columns with the same (internal mdb column name) next to each other
This principle is valid for the following type of comparisons:
- 2 snapshots of the same project and application (for instance PID Rev 1 versus PID Rev 2)
- 2 different projects of the same application (for instance PID Plant 1 versus PID Plant 2)
- any application/project versus an XLS list (for instance PID Rev 1 versus XLS LineList)
Add further applications to multi-application window
{#add-further-applications-to-multi-application-window .list-paragraph}
Further applications can be added to the multi-application window, which was created like described before. Drag an object from the application to be added to the Multi window table.
Additional applications will be included via Inner Join to the existing data.
Legend for multi-application window
At the bottom of UniversalReporter is the
legend block for the multi-application window. You can
hide/unhide this block by clicking on the Hide ( )/Unhide
(
)/Unhide
( ) icon.
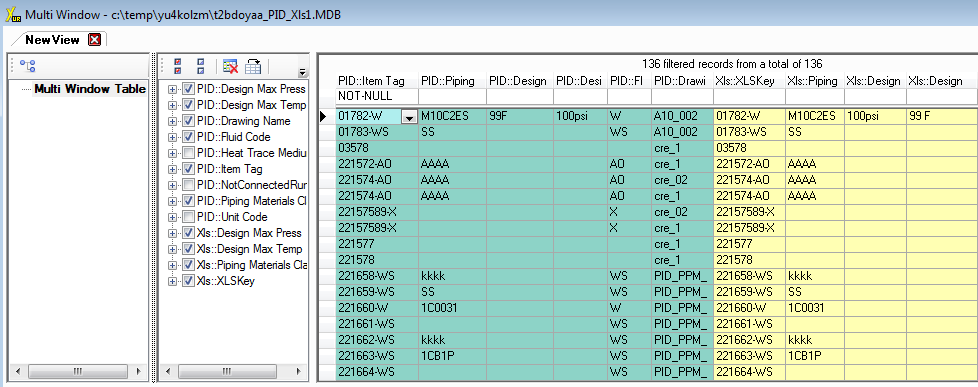
The legend block illustrates the source of each attribute by colour. Example below, attributes shaded in green are from the SPPID table and those shaded in purple are from XLS.

Context menu for legend block
Context menus for the legend block can be activated by a right mouse click on the record which needs changing.
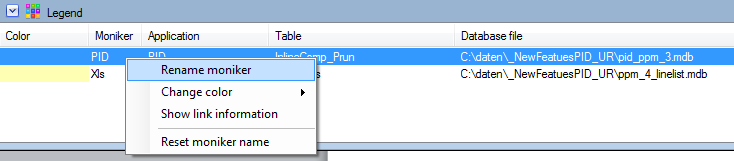
Changes that can be made:
- Rename moniker: the system automatically generates a moniker name, which is added to the attribute names to indicate the related application. This can be changed manually. Select Rename moniker and type in the new name.
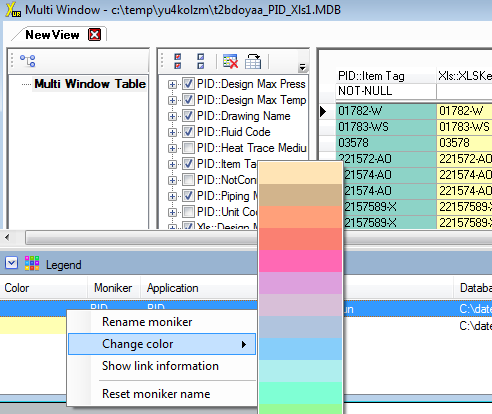
- Change colour: the system usually auto-selects a colour code for each moniker. This can be changed. Use Change colour and select the colour you want.
Select the colour you want. The result is as follows:
Show link information: this will show the tables the multi-window table is based on.
Reset moniker name: resets moniker name to its original value.
Working with multi-application window
Multi-application windows provide the same reporting functionality as windows for one application.
Additionally, there are some functions to display their relations to the windows on which they are based:
With a multi-application window active, the Show related windows button can be used to arrange the multi-application window together with all the related windows, tiled vertically.
Double clicking a row in a multi-application window will create additional views in all related single application windows. These views in the single application windows, called multi-view filter, display only data of the item that was selected in the multi-application window. This is helpful if data of that item have to be edited (see Edit functionality) which is not possible in a multi-application window.
) Match columns by name and (
) Hide matching columns without differences can be used to rearrange or hide these columns (see Working with rule data window).
Rule data window (Comparison window)
The RuleWindow can be created from the MultiWindow (as described in the chapter “Apply the Auto compare rule to the multi-application window”) but it can also be created directly from the combination of the original windows be selecting “Show differences” button (in this case the colour-coded difference report will be delivered as result).
Create the difference list report directly from the original windows
By choosing “Show differences” the data from the single windows is shown in one new window displaying the colour-coded differences. The MasterTag attribute is created based on the link which was defined to compare the data in the 2 windows.
Apply the Auto compare rule to the multi-application window
An Auto compare rule is available in a multi-application window, using right mouse click on Multi Window Table and selecting Apply rule →Auto compare. This rule compares all columns which have identical column names in the single-application windows the multi-application window was created from. The result of this comparison will be displayed in a new window, the rule data window.
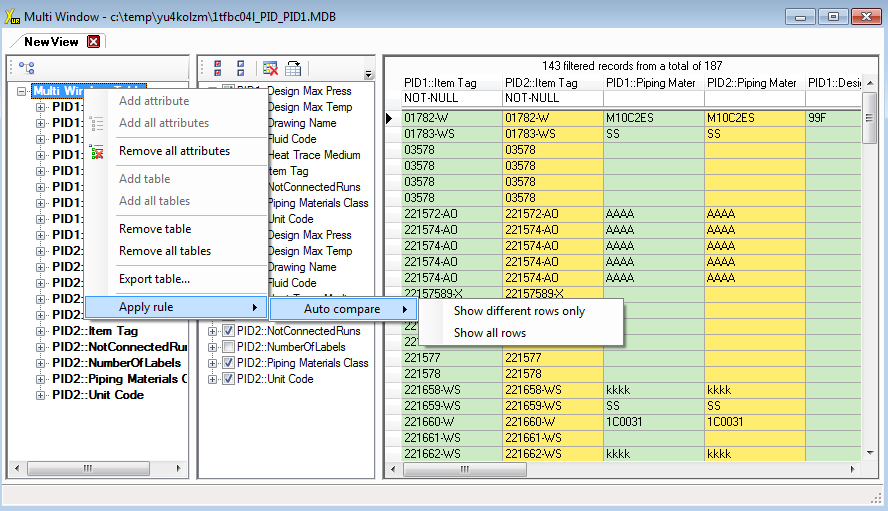
The user can decide whether to get all rows (Show all rows) or rows with differences only (Show different rows only), in the appearing Rule data window. Differences are highlighted in various colours, with corresponding columns having the same colour.
With button ()
Match columns by name, columns with the same name,
i.e. columns with the same colour, will be sorted together. With button
()
Hide matching columns without differences all columns
with matching name that do not have different values (that is columns
without coloured fields) will be hidden.
The result is a window displaying the differences colour-coded:
The result can be exported to a Spreadsheet.
Difference list created without template:
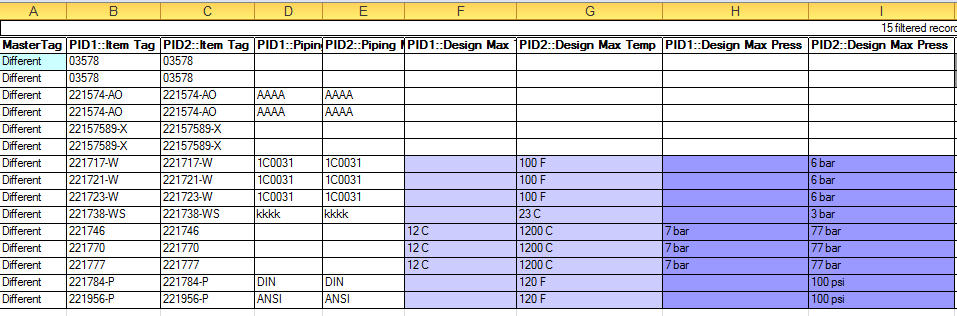
Difference list created with template (for reports created from the AutoCompare window it is possible to select the “Export grid with colour” option):
Working with rule data window
Rule data windows provide the same reporting functionality as single-application or multi-application windows.
Additionally, there are some functions to update the single-application windows, the rule data window is based on.
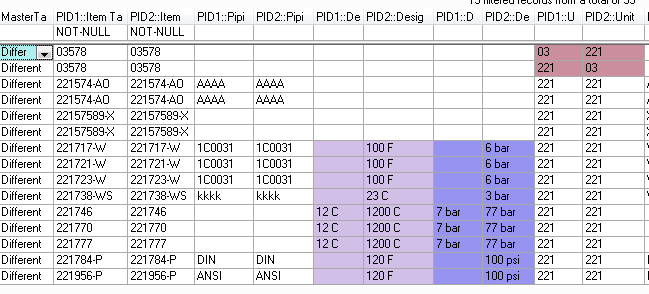
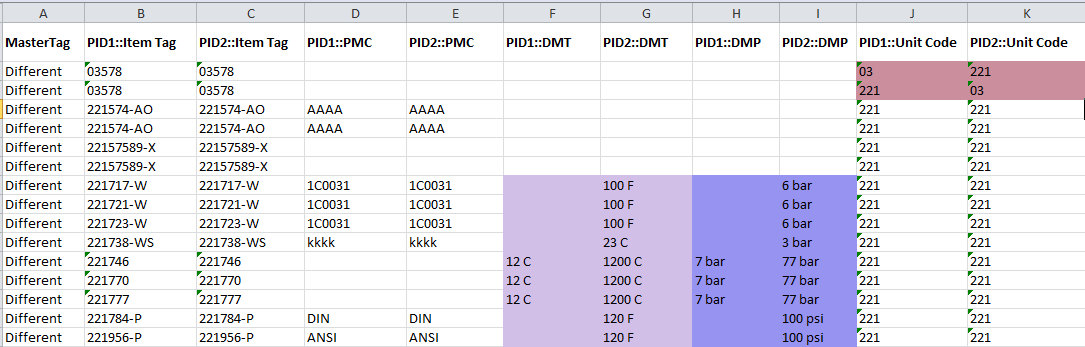
Every rule data window, created with the Auto compare rule, contains a column named MasterTag. When comparing data of two applications in the rule data window, the user can decide, by row, which application contains the correct data and can mark the rows with a so called MasterTag, which defines the leading application. Right mouse click on selected rows provides the functions Assign master tag for selected rows and Assign master tag for all rows combined with the names of the related single-application windows. Thus the user can assign the name of the window which has to become the master. To delete a master tag, assigned before, Nothing has to be selected for MasterTag.
The MasterTag column will display all assignments already made. If, for example, one single-application window is PID1 data and the other one is PID2 data, then the situation might be as shown below:
With MasterTag assigned, the single-application windows can be updated from rule data window with Rule → Update all columns or Rule → Update columns from grid only.
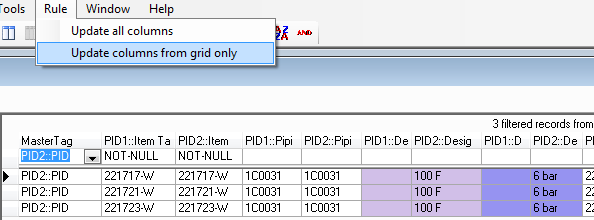
Updating in this context means, that columns in one single-application window will be updated with values from corresponding columns of the other single-application window. In the example above, all rows with MasterTag PID2::PID will use PID2data to update rows in PID1 data window.
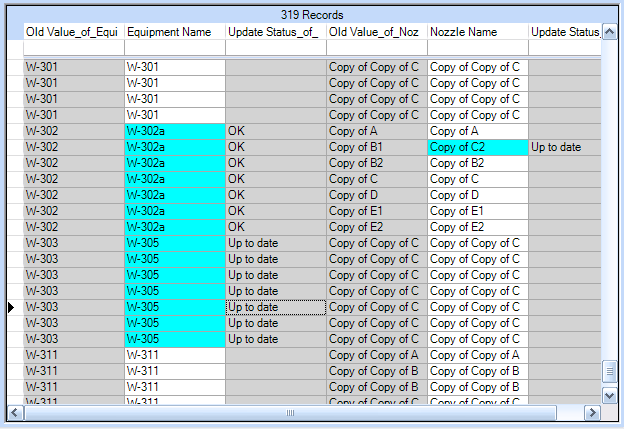
After update, the single-application windows will show the changed values highlighted in blue, exactly as if they had been changed manually (see Edit functionality). If a Column ChangeStatus is available, the updated rows will be marked in this column as "updated". In addition to updating existing data, the update functionality inserts rows, which exist in the master application but do not in the application to be updated. If ChangeStatus column is available, then these new rows will be marked there as "inserted". With ChangeStatus column available it is also possible to mark rows as "deleted" which do not exist in master application but do exist in the application to be updated.
After update, all rows of rule data window, that had been executed during update, will be marked in MasterTag column, e.g. with Updated from PID2::PID or Updated from PID1::Xls.
Update all columns executes the update for all corresponding columns in the selected tables, independent of which columns are displayed in the data grid of the single-application window or rule data window. With Update columns from grid only, the update is restricted to columns having the same name and being selected in rule data window. Insert will always be done for all columns.
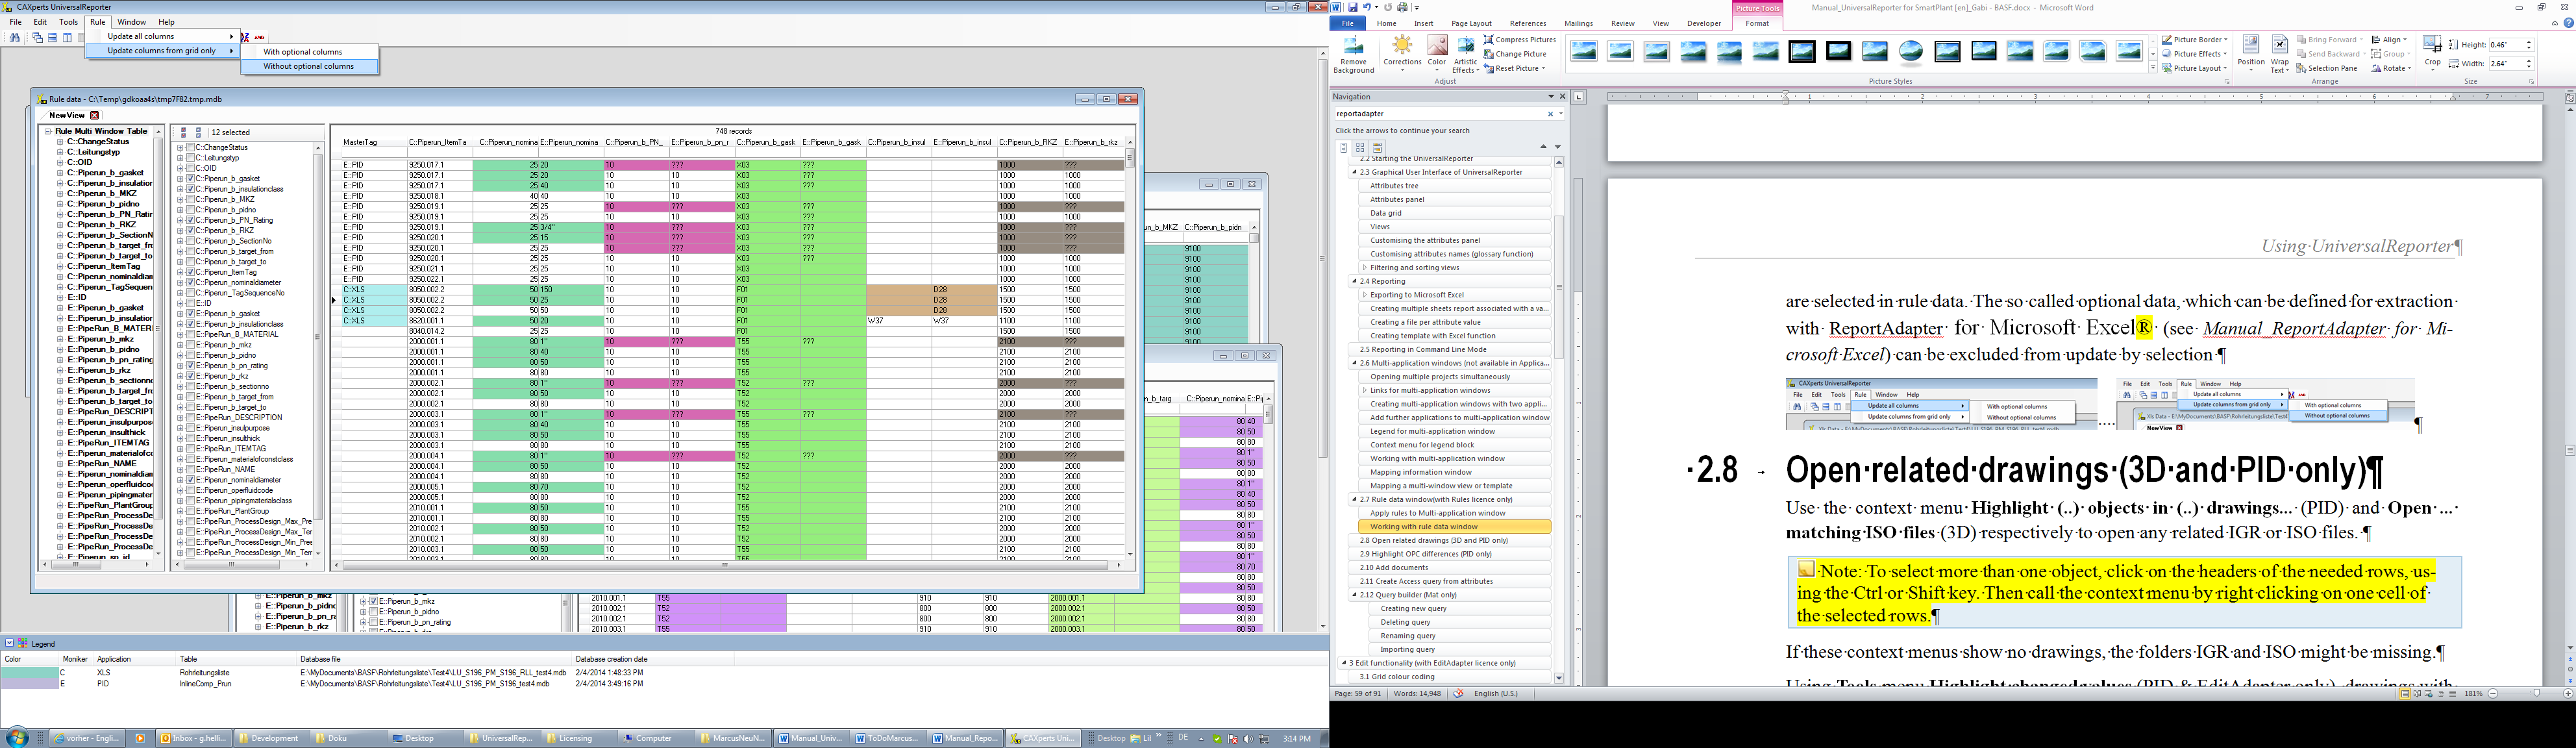
In some special cases, corresponding columns can be excluded from update, even if they are selected in rule data window. So called optional columns, which can be defined for extraction in ReportAdapter for Microsoft Excel (see Manual_ReportAdapter for Microsoft Excel), can be excluded from update by selecting Rule → Update all columns → Without optional columns or Rule → Update columns from grid only → Without optional columns.
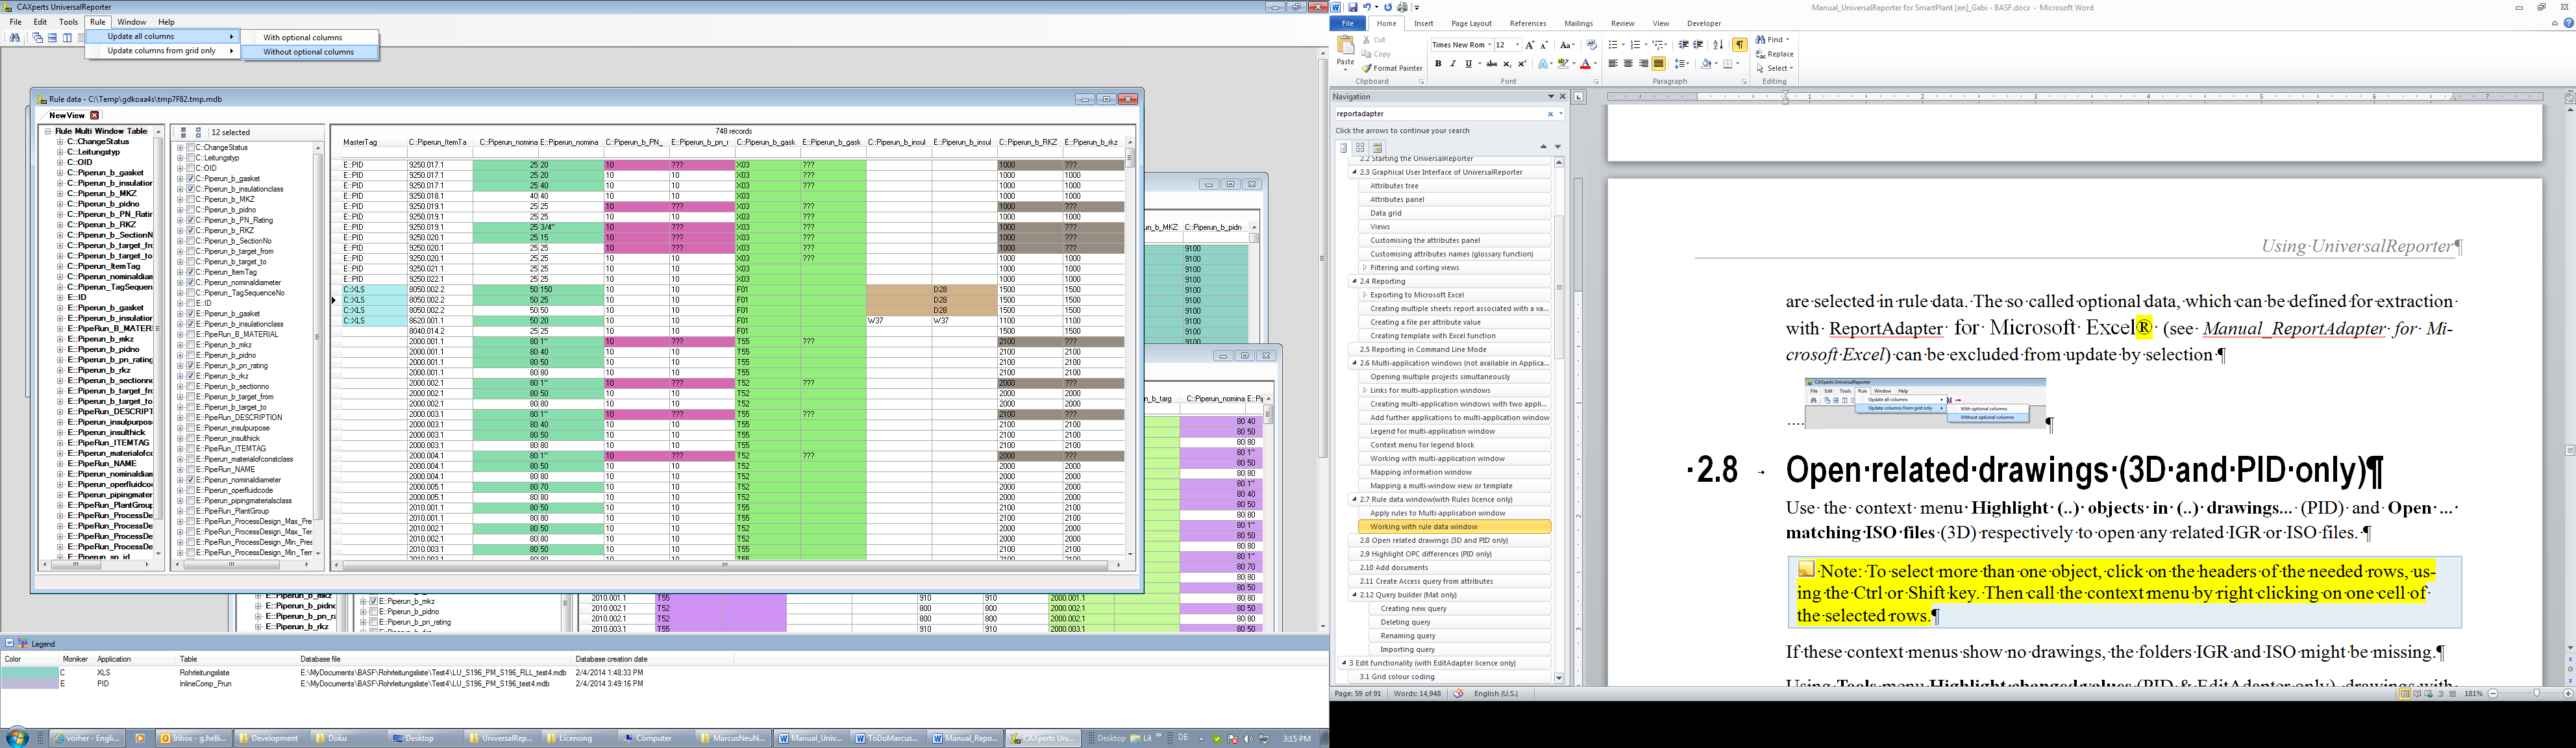
Open related drawings (3D and PID only)
Use the context menu Highlight (...) objects in (...) drawings... (PID) and Open ... matching ISO files (3D) respectively to open any related IGR or ISO files.
If these context menus show no drawings, the folders IGR and ISO might be missing.
Using Tools menu Highlight changed values (PID EditAdapter only), drawings with changed values will be displayed. Tools menu SP_ID/Representation_ID... (PID only) enables the user to search for SP_ID or Representation_ID in P&ID drawings.
Highlight OPC differences (PID only)
Tools menu Highlight OPC differences toggles marking of paired OPC attributes which are different.
For paired OPCs all Piperun and PlantItem attributes are compared and all inconsistencies in these attributes are marked in red. For OPCs which cannot be compared, because the partner is in stockpile or is not displayed in the data grid, the OPCTag is marked.
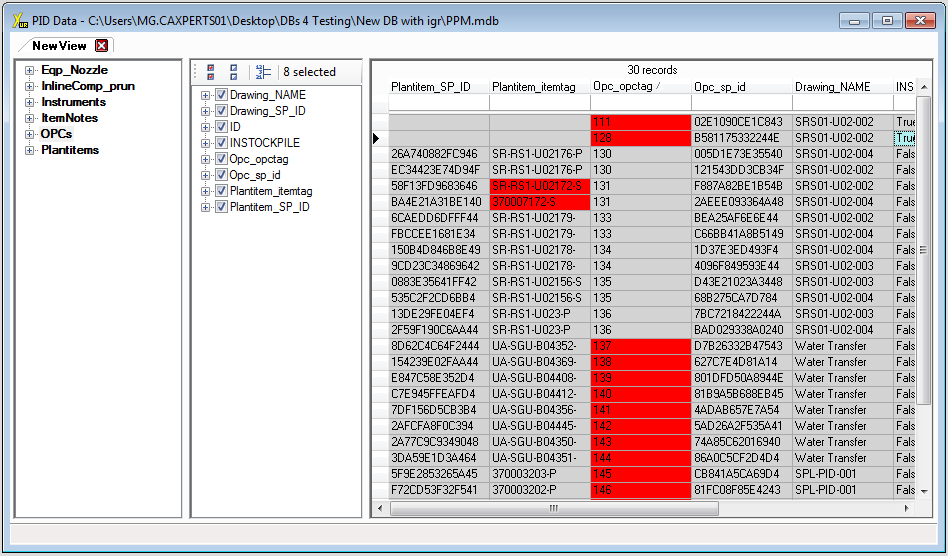
The list can be exported to Microsoft Excel keeping the red field with Tools → Export to Excel→ Export grid with colour (see Reporting).
Add documents
Use the context menu item Add documents to attach a document or a document link to a node. Documents will be stored in the folder as specified in Settings (Path to data files). Nodes with attached documents are marked in blue.
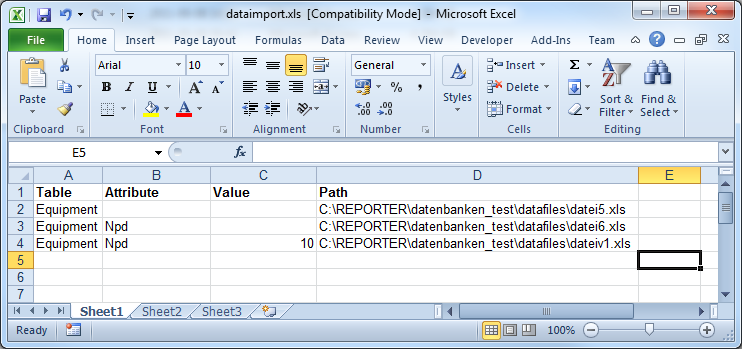
Instead of adding documents manually, an Excel file can be used. Simply use an Excel file like this (column order and headers in row 1 are obligatory).
Create Access query from attributes
Creates an additional query in the database which contains all attributes that are currently displayed on the grid.
Query builder (Mat only)
Creating new query
In UniversalReporter, you can create your own object by linking several objects together. This will help you create complex reports with data from several objects linked together. To use the query builder, the steps are:
From the main menu, select Tools → Query builder..., this will open the Query definition dialogue box.

Afterwards, select a query from Existing queries or click on the New button to create a new query. The New query dialogue box opens.
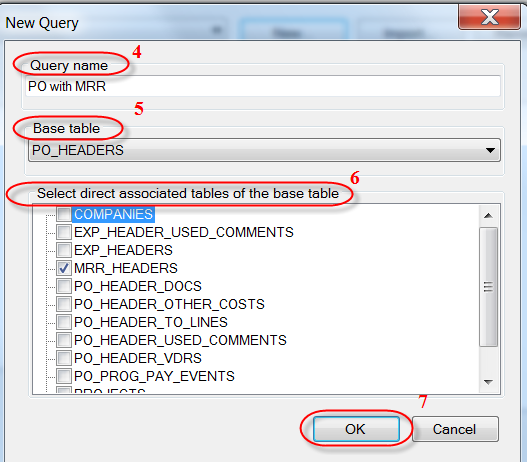
Enter the name of the new query in the Query name field.
Select a Base table.
Select table(s) associated to the base table.
Click the OK button. The information returns to the Query definition dialogue box.
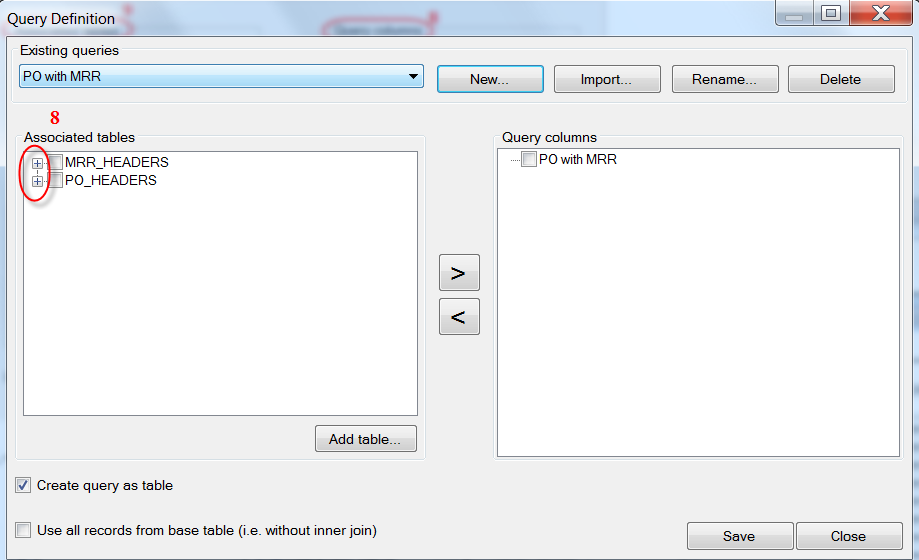
To add attributes from the base and associated tables, expand the tables by clicking on the + sign.
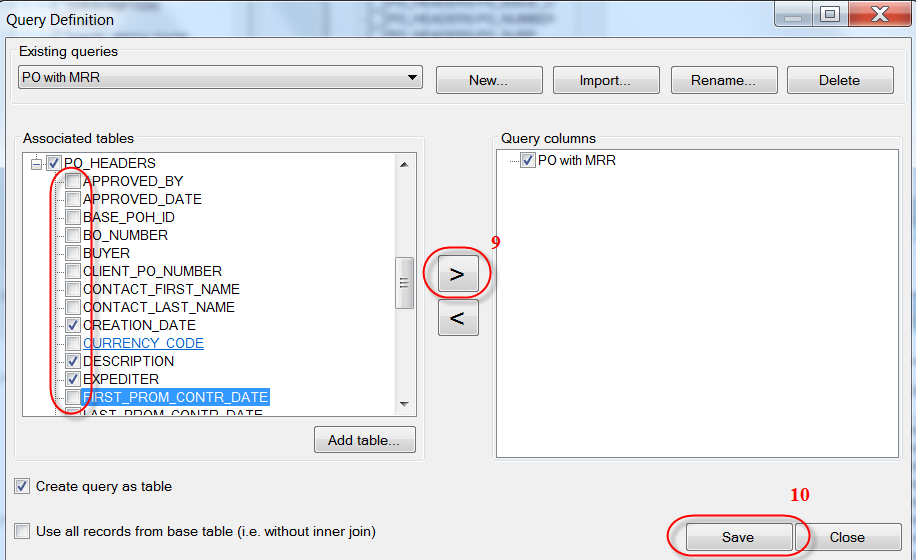
Select the required attributes in the Associated
tables field and click the button. This will move your
selection into the Query columns field.
button. This will move your
selection into the Query columns field.
Click Save when ready. The new object is now available in the attributes tree for use.
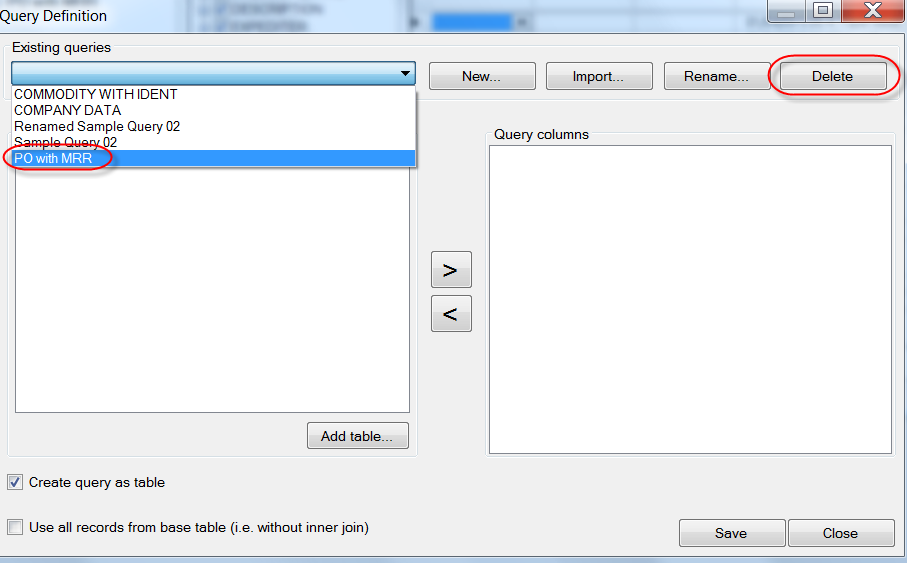
Deleting query
To delete a query, open the Query definition dialogue box (Tools → Query Builder), select the query and click on the Delete button.
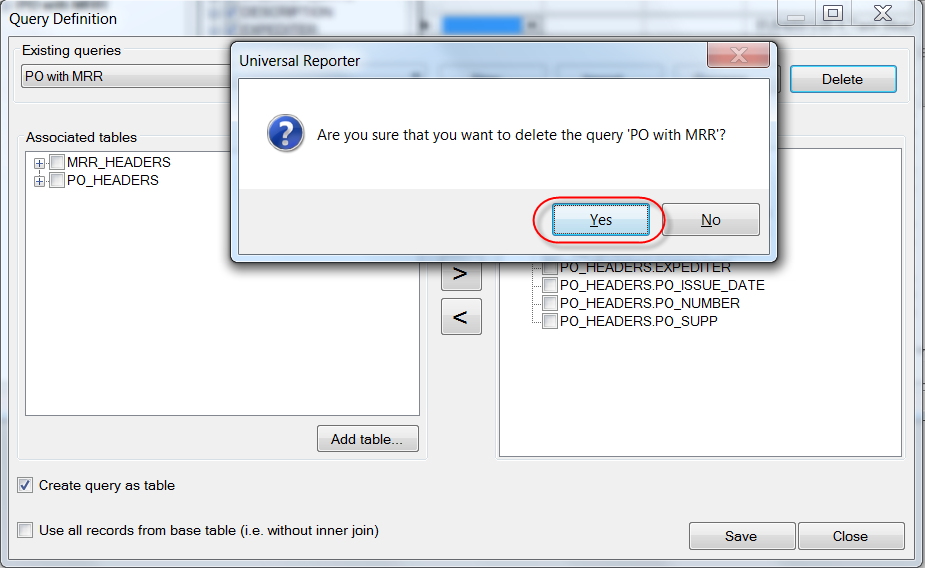
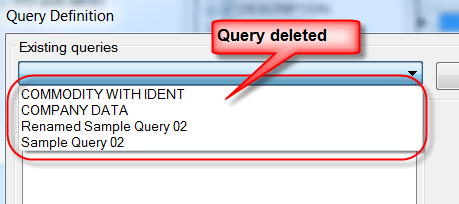
A warning message will appear. Click the Yes button to proceed.
Renaming query
To rename query, open the Query definition dialogue box (Tools → Query Builder), select the query and click on the Rename button.
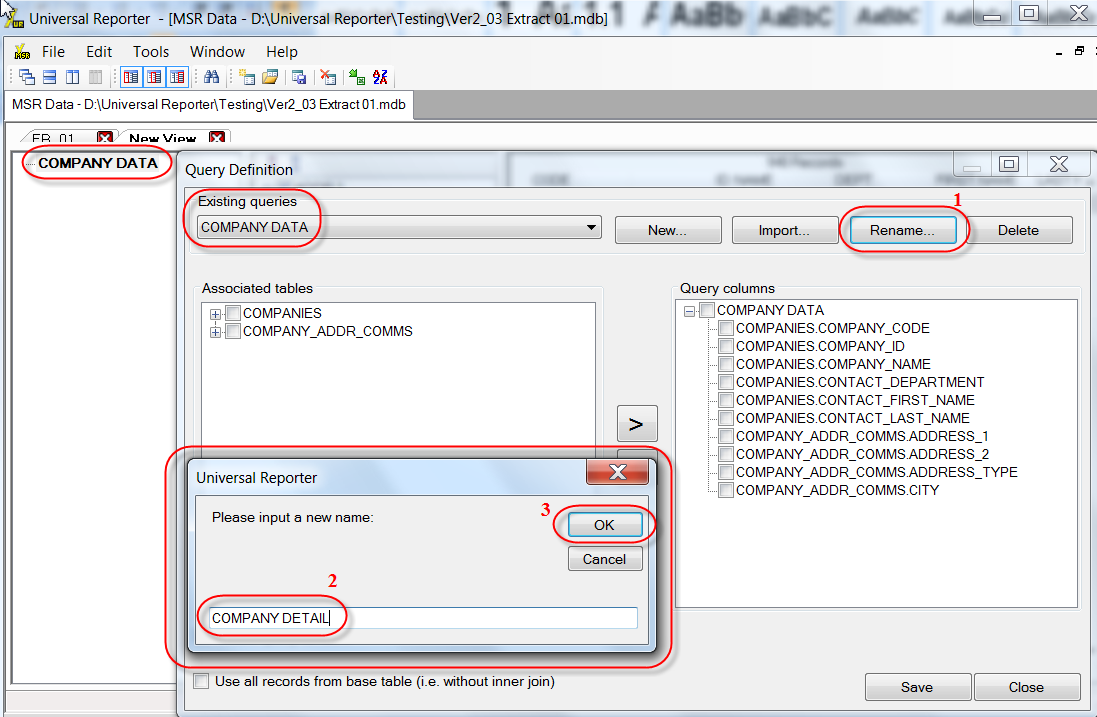
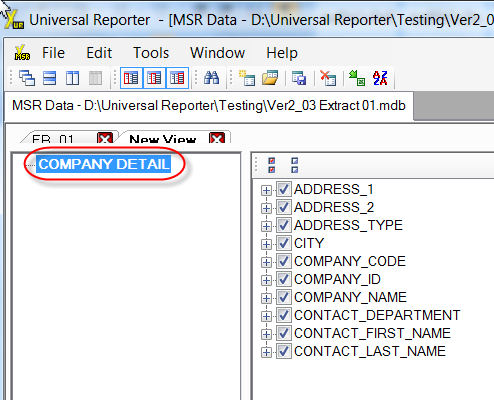
A dialogue box will let you enter a new name for the query. Click OK and close the query builder. The query in the attributes tree will get renamed.
Importing query
A user can import a query from another .mdb file. To import a query, open the Query definition dialogue box (Tools → Query builder), select the query and click on the Import button.
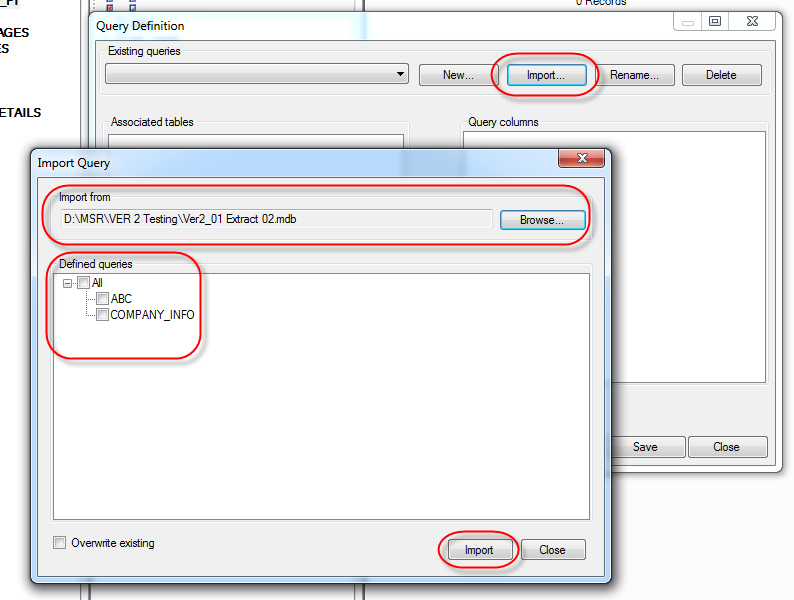
The import query dialogue box opens. Click on the Browse button to locate an .mdb file from which you want to import the query from. The system will then list all available queries from this .mdb file. Select the query/queries required.
Click Import.
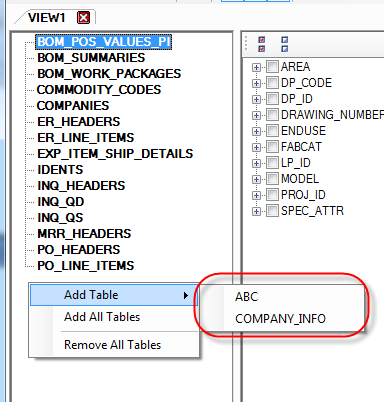
The imported queries are now available to be added to the attributes tree.
Edit functionality
(with EditAdapter licence only)
Grid colour coding
In order to show the different states of each value in the data grid, the cells of the grid are colour coded, when EditAdapter licence is installed. There are three colours as seen below:
Blue represents a cell that has had its value changed. Grey cells are cells that cannot be edited, due to user rights, or belonging to read only values in the Intergraph application. White coloured cells represent unmodified changeable values.
User rights for editing SmartPlant 3D data correspond to rights in SmartPlant 3D. For SmartPlants P&ID data user rights can be defined in separate privilege databases (see Attribute privileges). Rights for Microsoft Excel data can be defined in an Excel mapping sheet (see Manual_ReportAdapter for Microsoft Excel).
For SmartPlant P&ID data it is possible to remove the Read-Only flag from additional attributes like FluidCode, ItemTags and DrawingName and Number.
This can be done by changing the value of the parameter “UpdateExtendedAttributes”
In the ini file (.UserProfile\Appdata\Roaming\CAXperts\Universal Reporter\PID Data\
<PlantName>.ini the following parameter must be changed (or added of it is not available)
[Edit]
UpdateExtendedAttributes=1
0 = default behaviour FluidCode, ItemTag, Drawing Name and
DrawingNumber cannot be changed
1 = attributes like FluidCode, FluidSystem, Attributes for PipingConnectPoints can be modified
2 = ItemTag, Drawing Name and DrawingNumber can be modified (also FluidCode and PCP attributes)
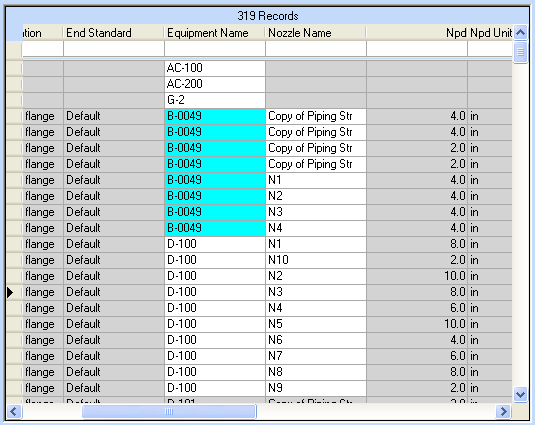
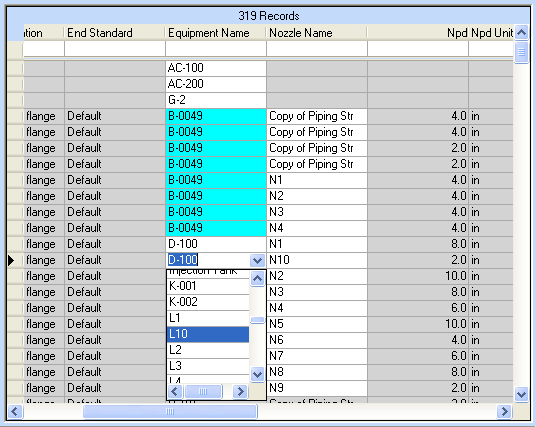
Changing a value
Editing a value in the grid is done very quickly with either the dropdown box (as seen below) or via direct input. Columns that are code listed can only be changed using the dropdown.
For P&ID data and for 3D data you can use the context menu Extended modifications for easier data modification. (see Grid context menu for PID only)
After every change, a window shows up and asks how the change should be applied (in the PID and in the 3D settings the prompt can be suppressed for P&ID data by checking the option Suppress prompt).
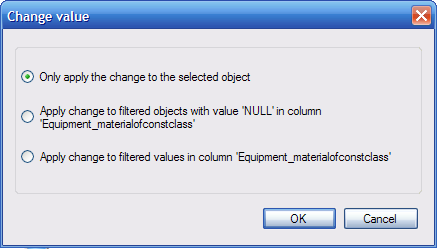
Only apply the change to the selected object: modifies all related rows, if applicable. E.g. if an equipment object has four nozzles, the nozzles will be listed in four rows. If the user changes the equipment name, the equipment name will be changed on all four rows.
Apply change to filtered values with…: only values shown in the filter will be changed, not necessarily all related values in the database.
Display changes
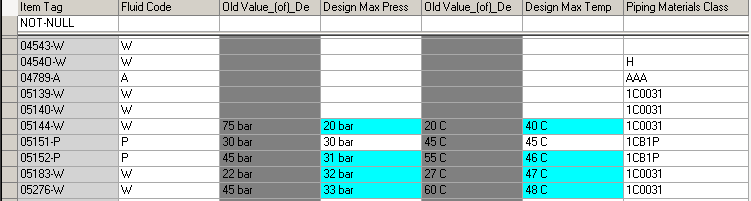
After changing a value, the Old value column will appear in front of the changed column. After writing changes back to the original application, the Update status column is added behind every column that has been updated (see below).
The Old value operator shows the original value of a changed attribute. This is to ensure that prior to writing changes to the application it is known which changes have been made.
The Update status displays one of four values after the changes have been written to the application. The first of the possible shown values for this column is "successfully updated". This simply means that all changes have been recorded without a problem. The second possibility is “Up-to-date”. This states that the value that has been changed in the report grid has the same value as the object in the application. The third possibility is an error message. This means that the value cannot be written to the application database. Amongst other things, this can be due to user rights, application rules or database problems. The last of possible values is blank. This means no action has been taken.
The columns Old value and Update
status can be added and removed where applicable, by checking
the respective operator in the Attribute panel. You can
also hide and display these values using the Toggle old value
and update status button ( ). As long as old values are
displayed, a “Changed values” filter is available in
all columns with changed values.
). As long as old values are
displayed, a “Changed values” filter is available in
all columns with changed values.
Reset values
It is possible to reset changes values in the grid (as long as they are marked as change).
Reset table will reset the complete table
Reset column will reset the column
Reset value will reset the single value
Import from Excel (3D, PID and XLS)
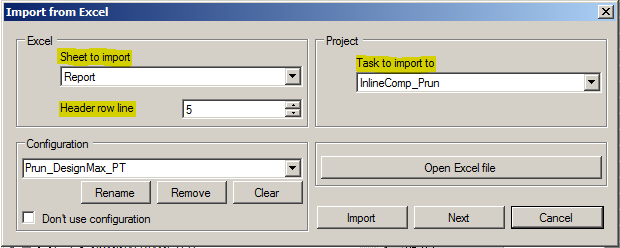
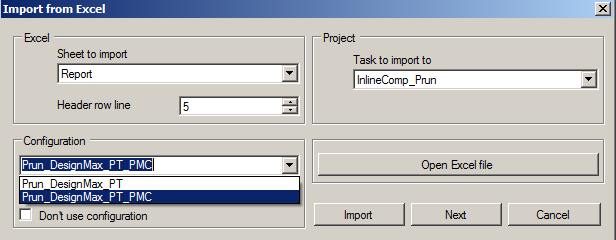
Use Tools → Import from Excel and select an Excel report. The Import from Excel window will appear.
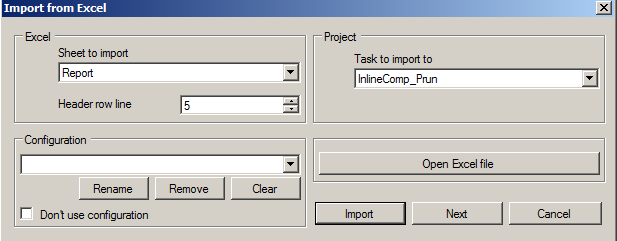
Importing without Import Configuration
Select Sheet to import and Task to import to and assign the Header row line (row in Excel sheet which includes the attribute names). After ticking the Next button you can select the attributes to be imported, by dragging them from the Ignore columns area to the Update columns field.
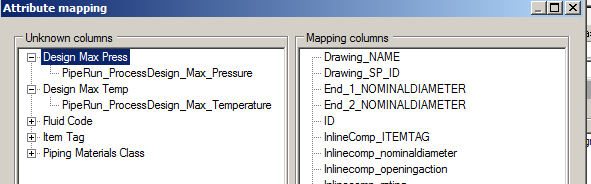
If the attribute names in the Excel file do not match the names in UniversalReporter then they are displayed in red and a mapping has to be done, using the Map button which calls an additional mapping window. To map Mapping columns to the respective Unknown columns just drag the needed attribute from the right side to the unknown column name on the left side. To remove mapping, drag the mapping name from the left side to the right.
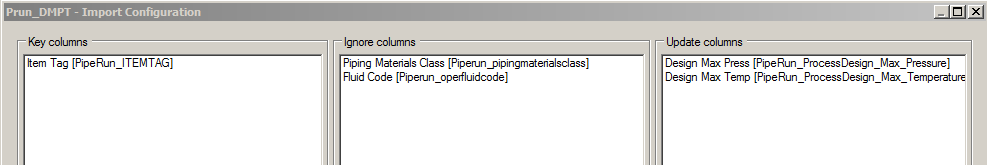
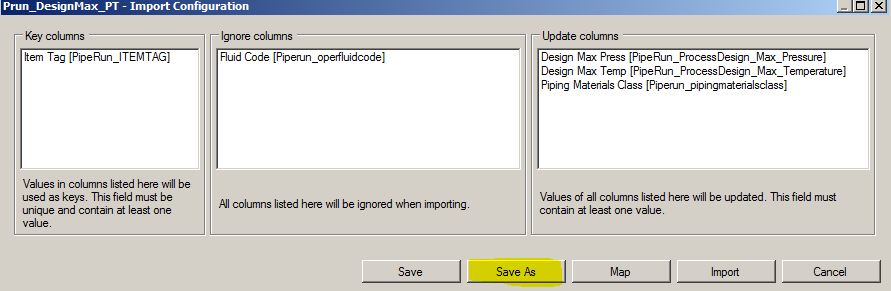
In Select attributes to change window, it is not allowed to add read-only or unmapped attributes to the right list; this will bring up an error message after clicking OK. You need to drag one or more attributes to the Key columns field on the left, to build up a unique key (e.g. OID or ItemTag) that matches the rows to be updated and at least one attribute to the right column. Attributes on the column in the middle will be ignored and thus do not have to be mapped.
Start the import by clicking OK.
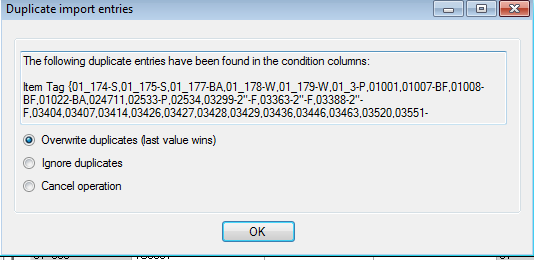
If duplicate keys are found in Excel then these will be displayed in a window and the user can choose if he wants to import the data ignoring the duplicate keys or the “last value wins” option (in this case the last row for rows with same key will be used for importing for all the objects identified).
After the import, modifications get blue mark-up on the grid and the column Old value will be filled.
For S3D data Code list values will be evaluated during import. Errors during evaluation will cause a rejection of these modifications.
Importing with using an Import Configuration
Creating Import configurations
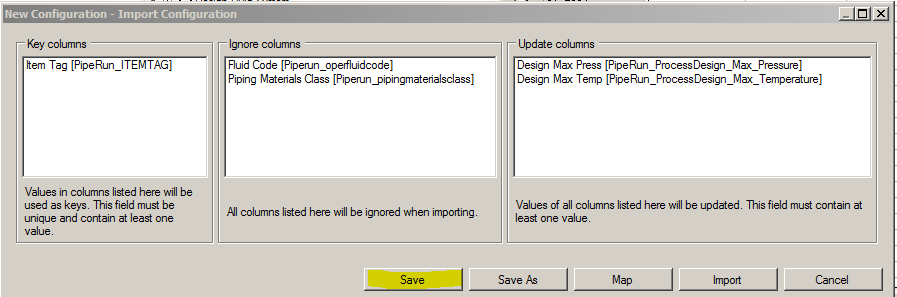
An attribute configuration can be created by saving the combination of Key column and Update columns in relation so that they can be used for imports from different Excel files.
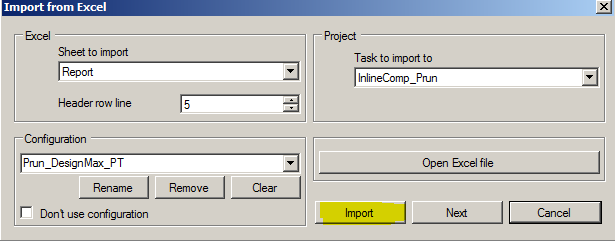
When the user selects an ImportConfiguration clicking the “Import” command will directly run the import and the result will be visible in Universal Reporter.
Parameters for identification of valid Import configurations:
As marked in the screenshot above the 3 parameters which are used to define valid Import configurations are
- the name of the Excel sheet in the Excel file
- the row number of the header row (containing the column headers)
- the task (table) to which the data will be imported
It is also possible to create a new Import configuration based on an existing one by using the “Save As” button in the ImportConfiguration window:
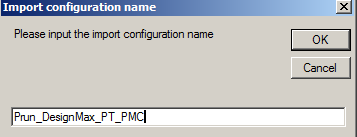
In this case the user can choose between the valid Import configurations:
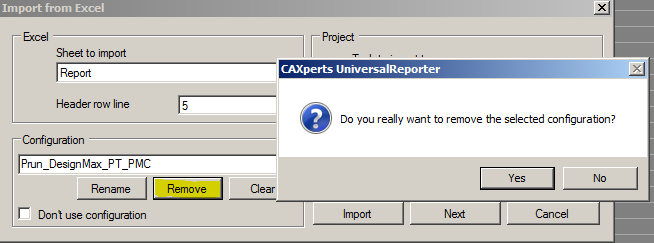
Removing an Import configuration
An Import configuration can be removed by selecting it and clicking on the “Remove” button.
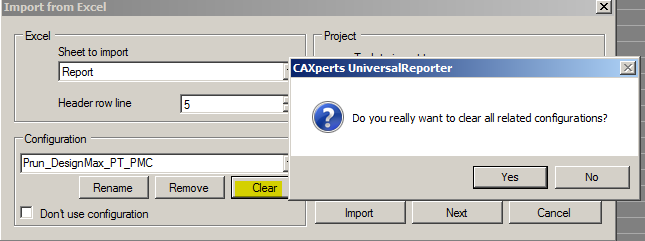
Removing all Import configurations
The “Clean” button will remove all related Import configurations (matching to the Excel Sheet and Target Task / Table) from the database.
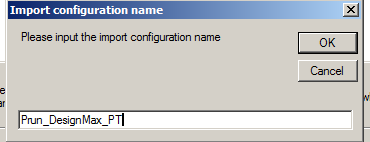
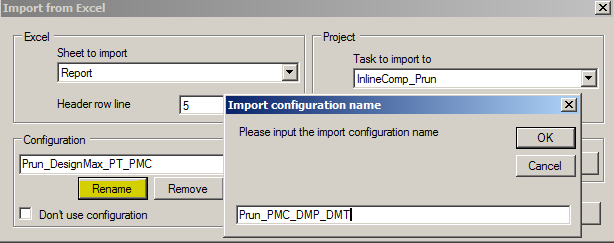
Renaming an Import configuration
Switching to the import method without Import configuration
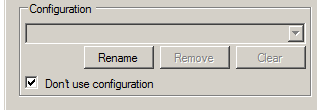
If the user wants to switch to the import method which does not use an Import configuration he can check the “Don’t use configuration” check box:
Writing changes to application
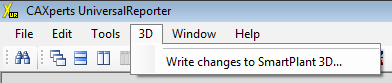
To write changes to an application, this application has to be installed on the computer. From the menus, select the respective application (3D, PID or Xls), e.g. 3D -> Write changes to SmartPlant 3D.
Upon the selection of this option, the Update attributes tables selection window appears. Select the tables to be updated from this window
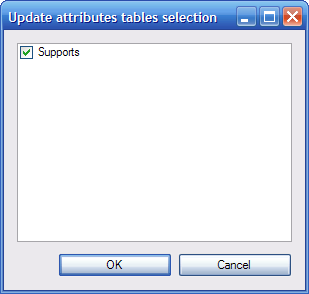
The changed values of the selected tables will be written to the application, using the application interface. Once this process is complete a message box will appear, stating that data have been written to the application successfully and, in UniversalReporter, Update status columns will display the update status for every changed attribute.
For P&ID data you can select either to Write changes to SmartPlant P&ID... or to Write changes to SmartPlant P&ID with system editing... This will set the respective option in SmartPlant P&ID. Thus, with system editing will result in a propagation of the changed values to connected items.
For Excel data, after selecting the tables to be executed, a new window appears where the user can select the Excel file that will be used for write back. Additionally he can assign a revision number and colour which will be used to mark the changes in the Excel file. To assign the revision number to the changed rows in the Excel sheet, this sheet has to contain a column with the name Revision.
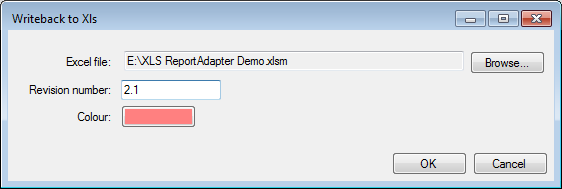
xlsKey, which contains the unique identifier, and this name has to be mapped to the corresponding attribute in UniversalReporter (e.g. ItemTag).
After updating and depending on necessity, it may be necessary to export a new Access database from the application with ReportAdapter, e.g.to see which values were changed additionally because of rules in the application.
Permissions and settings
Permissions
Assign permission with Tools -> Permissions.
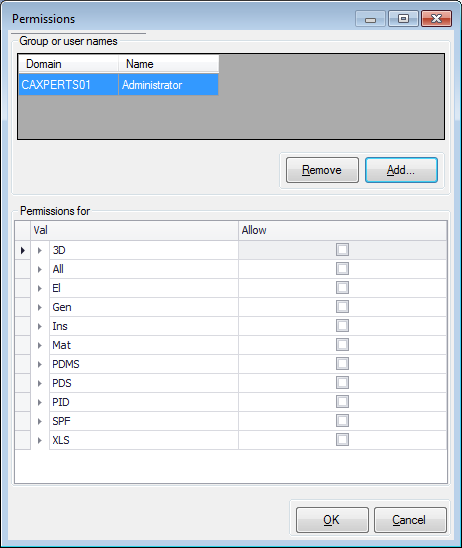
Group or user names contains either the domain and user name, the domain and group name, the computer and user name or for those computers that are not in a domain, the computer and user name.
As long as the setting Add new users with full permissions is checked (see 6.3 Global settings), each new user which logs on to the computer and starts UniversalReporter will automatically obtain full permissions.
The permissions path can also be designated in the settings. This way multiple users can utilise the same permissions DB.
Both the Add new users with full permissions option and the Permissions .mdb file setting require the All -> Permissions permission to change.
Warning: Removing the Add new users with full permissions and the All -> Permissions setting for all users will disable any future permission modification (unless the permissions database password is known)
Warning: The program will not start without a valid permissions database.
Specific permissions:
Attribute_Manager: allows the opening and changing of the attribute manager for the specified program part
Attribute_Permissions: allows the editing of editable columns in the Attribute Permissions window (PID Only)
Change_Values: allows the editing of values in the data grid (Edit Only)
Glossary: allows the viewing and modification of the glossary table
Import_from_Excel: allows importing changes from excel sheets (Edit Only)
Link_Configurator: allows editing links needed for creating multi-application windows
Save_View: allows saving over existing views. If disabled will only allow "Save as" dialog and will not allow overwriting of existing files.
WriteBack: allows the user to utilize the WriteBack function (Edit Only)
Attribute permissions (PID only)
Attribute permissions are enabled and disabled in the settings under PID Settings -> Enable attribute permissions. The default is disabled.
The directory of the attribute permissions is modifiable using the Settings -> PID Settings -> Attribute permissions directory. If the directory is empty, new (empty) databases will be created there. These database files can be copied and renamed to define the privileges for additional plants (source and target plant have to have identical attributes).
Locked attributes are shown in grey colour on the grid; for users that are not listed in the privileges database, all attributes will be locked.
Using Tools -> Attribute permission the modification privileges for attributes can be defined user- or group-wise.
Global settings
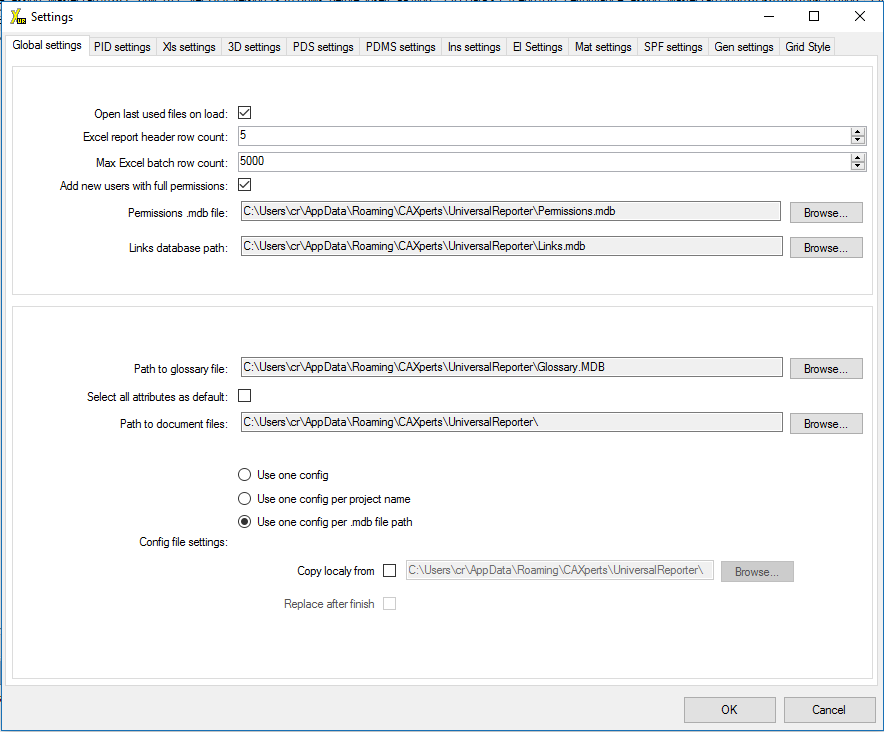
Open last used files on load: load the last projects on program start. If check box is not checked the system will require you to manually open the project upon program start-up.
Export report header row count: set the default for header row for Excel report created without template and for new templates.
Maximum Excel batch row count: There is a known memory leak in Excel. If you are experiencing any difficulties try to reduce this number. If the number of defined rows is exceeded, the report will be split during creation and merged in the end. This does not influence the result but performance is decreased.
Add new users with full permissions: if checked, new users will get full administrator rights. see permissions
Permissions .mdb file: path to store the permissions database.
Path to glossary file: set the location of the glossary .mdb file. If a global path is set for glossary then the glossary is used for all applications. This means that table names have to be unique across applications. If there are duplicate table names, the glossary path must be set for every application separately.
Select all attributes by default: when checked, attributes in the attribute panel will be selected when an object gets added to the attributes tree.
Path to data files: set the default location of the document files which can be attached to nodes of the attributes tree. (see Appendix B: context menus)
Use one configuration: configuration settings are identical for all projects.
Use one configuration per project name: configuration settings shall be bound to the project name.
Copy locally from: if checked it will copy the settings from the path specified.
Configuration file always is used locally (e.g. C:\Program Files (x86)\CAXperts\UniversalReporter\Config). If a global configuration is needed then the configuration file can be copied from a global location during start-up of the program.
Replace after finish: if checked the local configuration file will be saved to the path where it was copied from, thus overwriting the global configuration file.
Use one configuration per .mdb file path: configuration settings shall be bound to the mdb file path (includes a hash value of the file path in the configuration file name).
Links database path: set the location of the links database (links.mdb).
Settings per application
PID settings
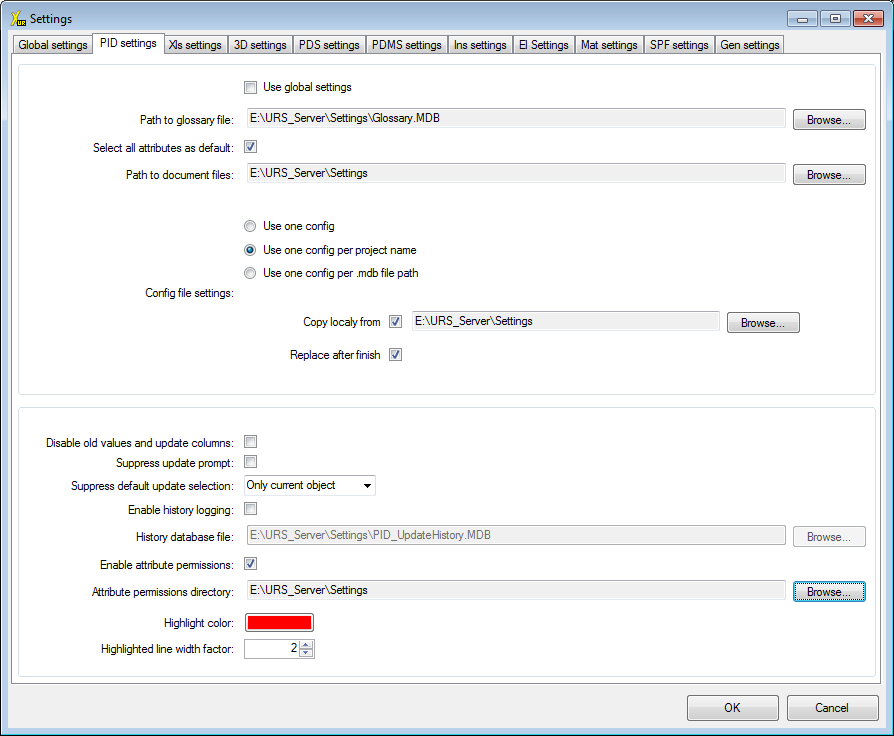
Use global settings: To override global settings for this application, uncheck this box.
Enable history logging: if checked, all changes done in SmartPlant P&ID with write back function will be documented in an Access database.
History database file: defines the location of the change history database
Enable attribute permissions: if checked, attributes are locked according to user rights specified in the attribute permissions database (see Attribute permissions (PID only)). Every project has its own attribute permissions database. If enable attribute permissions is set, user rights must be defined for each project.
Attribute permissions directory: defines the directory where the attribute permissions databases for all projects are kept.
Highlight colour: the software will use this colour to highlight objects in SmartSketch
Highlighted line width factor: the software will use this line width to highlight objects in SmartSketch
Suppress update prompt: suppresses the prompt that asks for the modification target when a cell value was changed.
Suppress default update selection: sets how modifications should be applied by default.
Other settings: See Global settings.
Grid settings
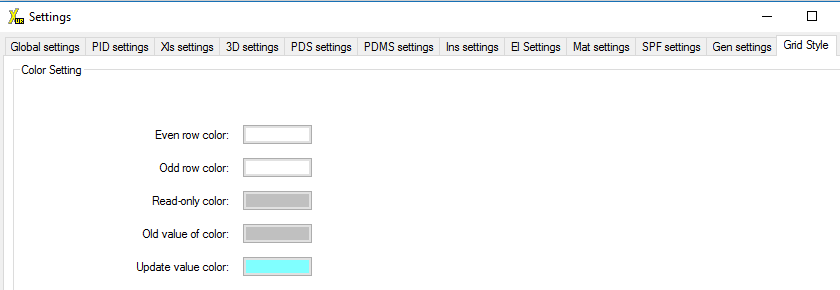
Grid settings allow the user to change the colour for the Read-Only, Old_value, Update value colour and also to choose a different colour for even and odd rows.
Settings for other applications
- Use global settings: To override global settings for this application, uncheck this box.
Other settings: See Global settings or PID settings.
Appendix A: menu
File
Open project…
Shows a file dialogue to open a Microsoft Access database containing the project data.
Recent projects
Shows a list of the most recently used projects. Click on an item on this list to open the project.
Open view…
Opens a UniversalReporter view file (.cvf).
New view…
Creates a new view tab.
Save view
Saves the current view as a UniversalReporter view file (.cvf).
Save view as…
Saves the current view as a UniversalReporter view file (.cvf) to a new location.
Save all views…
Saves all views as UniversalReporter view files (.cvf).
Close view
Closes the current view.
Close project
Closes the current project.
Exit
Closes UniversalReporter.
Edit
Search in attributes tree
Brings up the Search in attributes tree form to search the tree of attributes.
Tools
Links configurator
Shows the Links configurator window to create links for multi-application windows. (see Links )
Attribute permissions (PID only)
Shows the attribute permissions window (see Attribute permissions).
Attribute manager
Shows the attribute manager window, see Customising the attributes panel.
Glossary
Opens the project specific glossary, see Customising attributes names (glossary function).
Report variable definition
Shows the Report variable definition window to define variables that can be used in Excel reports (see 4.4 Reporting)
Custom sorting
Shows the Sort window to sort multiple columns in the data grid (see Filtering and sorting views)
Create Access query from attributes
Creates a query including all attributes displayed in the data grid and saves it to the current database. (see 4.12 Create Access query from attributes)
Export to Excel
Creates Excel report, see Exporting to Microsoft Excel.
Export to HTML, PDF, CSV
Creates report in HTML, PDF or CSV Format from the data displayed in the data grid. With this functionality no template can be used.
Load documents from Excel
Assigns document links, provided in an Excel sheet, to items in the attributes tree. See Appendix B: context menus / Add document).
Show info
Opens a table which displays information related to the database that contains the extracted data. This information may contain an expiration date. If this date is exceeded a warning will be displayed whenever the database is opened.
Remove read-only from view
If a view is locked, i.e. read-only, clicking this menu item will remove the lock. (see Views)
Import from Excel (3D and PID only)
Imports data from an Excel Sheet to the current database. (see 5.4 Import from Excel)
Permissions
Shows the Permissions window where user rights in UniversalReporter can be defined. (see 6.1 Permissions)
Settings
Includes global settings and setting for the different applications. (see 6 Permissions and settings). All settings will be stored in .ini files. (e.g. in C:\Program Files (x86)\CAXperts\UniversalReporter\Config)
Application specific menus
(PID, 3D, Mat, Xls, Rule)
Highlight changed values
(PID only)
Opens all drawings with items to be changed and highlights these items. (see Open related drawings (3D und PID only))
Highlight SP_ID or Representation_ID (PID only)
Brings up the Highlight values window to search for SP_ID or Representation_ID in all P&IDs. (see Open related drawings (3D und PID only))
Highlight OPC differences (PID only)
Toggles marking of paired OPC attributes which are different. (see 4.10 Highlight OPC differences (PID only))
Write changes to SmartPlant P&ID with system editing (PID only)
Writes changed values back to SmartPlant P&ID using the system editing functionality. (see 5.5 Writing changes to application)
Write changes to SmartPlant P&ID (PID only)
Writes changed values back to SmartPlant P&ID. (see 5.5 Writing changes to application)
Show history (PID only)
If that option is selected in the settings, all changes that were made in writing back to SmartPlant P&ID get stored in a database. This change history database will be opened and displays the data concerning the current project.
Write changes to SmartPlant 3D (3D only)
Writes changed values back to SmartPlant 3D (see Writing changes to application)
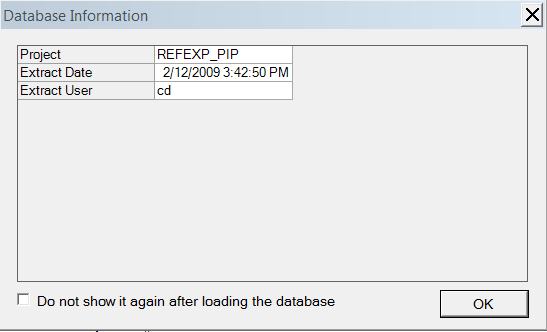
Show database information (Mat only)
Opening UniversalReporter for SmartPlant® Materials normally triggers the following dialogue box. This dialogue box gives you information on the current database the system is linked to. See sample below:
Query builder (Mat only)
Helps to create your own object in the database by linking several tables or queries from the database together.
Write changes to Xls (Xls only)
Writes changed values back to Microsoft Excel (see Writing changes to application)
Update all columns (Rule only)
Updates single-application windows out of rule window (see Working with rule data window) including all columns having the same column name in both single-application windows.
Update columns from grid only (Rule only)
Updates single-application windows out of rule window (see Working with rule data window) including columns displayed in the grid and having the same column name in both single-application windows.
Window
Cascade
Cascades the project windows.
Tile horizontally
Tiles the project windows horizontally.
Tile vertically
Tiles the project windows vertically.
Show related windows
Only active when a multi-application window is selected. Arranges the multi-application window together with all related windows.
Show attributes tree
Shows / hides the attributes tree.
Show attributes
Shows / hides the attributes panel.
Show grid
Shows / hides the data grid.
Window toolbar
Shows / hides the window toolbar.
Views toolbar
Shows / hides the view toolbar.
Help
Manual
Show this manual.
Labs
Provides a list of labs in which examples of how to use UniversalReporter are described step by step.
Update licence
Shows the licence update form, to update licences or to change license path. (see Licence)
About UniversalReporter
Displays version information of UniversalReporter.
Appendix B: context menus
There are context menus for each section of the UniversalReporter. The menus can be reached via right clicking on the associated item. Some context menu functions are also available on the menu bar and/or toolbar.
View context menu
The view menu shows up when you right click on the view tab:
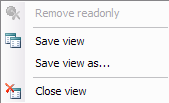
Save view: saves the currently selected view. If the selected view has not been saved before, the Save as dialogue will be opened.
Save view as: saves the view under a certain file name.
Close view: closes the selected view.
Node context menu
In the attributes tree, depending on what item you right click on a slightly different context menu will appear, see Attributes tree.
Object nodes
If you right click on the object node, the following context menu will appear:
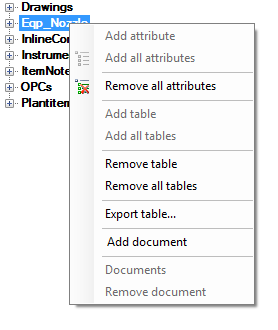
Add attribute: opens a pop-up menu listing all attributes which are not already added. Select one to add it to the selected node.
Add all attributes: add all available attributes to the selected node.
Remove all attributes: remove all attributes assigned under the selected node.
Add table: opens a popup menu listing all tables which are not already added. Select one to add it to the attributes tree.
Add all tables: add all available tables to the attributes tree.
Remove table: remove selected node from the attributes tree.
Remove all tables: remove all tables from attributes tree.
Export table...: Exports the selected object to an external database. The object can be renamed while saving it.
Add document (in single-application windows only): attaches a document to the selected item (see Add documents).
Documents (in single-application windows only): displays all attached documents. Open the document by selecting the document name.
Remove document (in single-application windows only): displays all attached documents. Remove the document by selecting the document name or remove all documents by selecting All.
Apply rule → Auto compare (with multi window table only): Starts the auto compare rule (see Apply rules to multi-application window), available only in multi-application window, with Rules licence.
Attribute node
If you right click on the attribute node, the following context menu will appear:
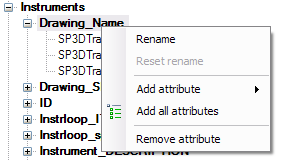
Rename: renames the target attribute node. Only works if a glossary is selected under Tools → Glossary.
Reset rename: reset the renaming of an attribute back to the database column name.
Add attribute: opens a popup menu listing all attributes which are not already added. Select one to add it to the selected node.
Add all attributes: add all available attributes to the selected node.
Remove attributes: remove the selected attribute.
Add document, Document and Remove document: see Object nodes
Value node
If you right click on the value node, the following context menu will appear:
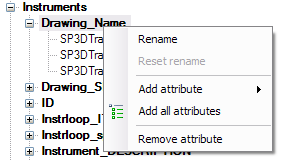
Add attribute: opens a popup menu listing all attributes which are not already added. Select one to add it to the selected node.
Add all attributes: add all available attributes to the selected node.
Remove all attributes: remove all attributes from the selected node (not possible for value nodes).
Add document, Document and Remove document: see Object nodes
Attribute context menu
Right click on the attributes panel to open the Attribute context menu or use the respective icons.
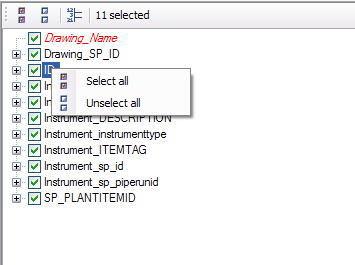
Actions available are as follows:
Select all (
 ):
selects all attribute nodes
):
selects all attribute nodesUnselect all(
 ):
unselect all attribute nodes, including operator nodes.
):
unselect all attribute nodes, including operator nodes.Toggle old value and update status (
 ):
(only with EditAdapter licence) Shows / hides
old value and update status columns in
the data grid.
):
(only with EditAdapter licence) Shows / hides
old value and update status columns in
the data grid.
Grid context menu
Context menu for filtering
The context menu shown below is the first and primary way to filter (see Filtering and sorting views). Right click on a grid cell to open it.
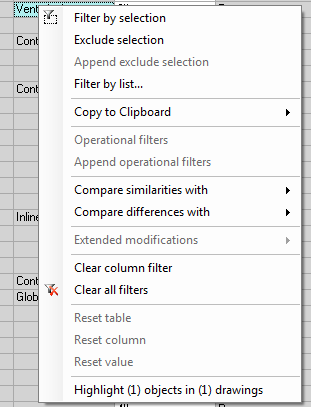
Filter by selection: sets the column filter to the current value in the selected grid cell.
Exclude selection: sets the current column filter to exclude the value in the selected grid cell.
Append exclude selection: excludes the current value in addition to the current value(s) in the filter. This option is only enabled if the column has been filtered by exclusion.
Filter by list: displays a list where all values to be used for filtering can be selected.
Copy to clipboard: copy the displayed name or glossary name of the current column to the clipboard.
Operational filters: these filters are only available for numeric and date/time columns. The popup menu contains filters for ‘Greater than’, ‘Less than’, ‘Greater than or equal to’, and ‘Less than or equal to’, all are relative to the current selected grid cell.
Append operational filters: these filters are only available for numerical or date/time columns and if a previous operational filter has been set in the current column. This option enables the possibility to filter for values between two values.
Compare similarities with: compare values between two attributes for similarities. This is not possible between different data types.
Compare differences with: compare values between two attributes for differences. This is not possible between different data types.
Extended modifications/Concatenate (PID and Xls only): not available for locked cells. Opens the Concatenate window to concatenate all values of items included in the selected column with additional strings.
Clear column filter: clears the current column filter in which the selected grid cell resides.
Clear all filters: resets all filters in the grid. With the exception of filters set in path columns (see Data grid).
It is also possible to filter by selecting an item from the filter combo box at the top of each column (see Filtering).
Application specific context menu
Grid context menu for 3D only
Open (...) matching ISO files: opens isometric drawings related to the selected item, (see Open related drawings (3D and PID only)). Only available if drawings were extracted with 3D ReportAdapter and folder "ISO" exists. If there are no isometric drawings then Iso information missing is displayed in the context menu.
Grid context menu for PID only
Highlight (...) objects in (...) drawings: opens P&IDs related to the selected item see Open related drawings (3D and PID only). This option is only available if P&IDs were extracted with PID ReportAdapter and the folder "IGR" exists. If there are no isometric drawings then No drawings is displayed in the context menu.
Grid context menu for PID and Xls only
Extended modifications/Concatenate: not available for locked cells. Opens the Concatenate window to concatenate all values of items included in the selected column with additional strings.
Extended modifications/Regular expression: not available for locked cells. Opens the Regular expression window to change all values of items included in the selected column based on regular expressions.
Extended modifications/Replace: not available for locked cells. Opens the Replace window to change all values of items included in the selected column by replacing parts of these values.
Grid context menu for EditAdapter licence only
Reset table: Reset the values of all columns to the old value. Only available if at least one cell value is different from old value.
Reset column: Reset all values of the selected column to the old value. Only available if at least one value in the column is different from old value.
Reset value: Reset the value of the selected cell to the old value. Only available if the cell value is different from old value.
Grid context menu for Rule data with Rules licence only
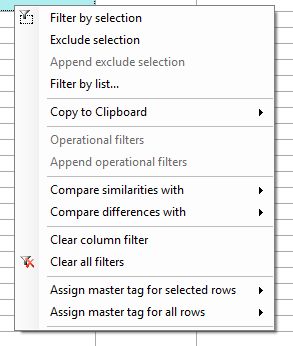
Assign master tag for selected rows: Assign to all selected rows which application is the master for updating single-application windows out of Rule data window. Only available with column MasterTag.
Assign master tag for all rows: Assign to all rows which application is the master for updating single-application windows out of Rule data window. Only available with column MasterTag.
Appendix C: toolbar buttons
There are several toolbars in UniversalReporter.

The toolbar allows faster access to the most important functions from the menu.
Windows toolbar
 : cascade windows.
 : tile windows
horizontally.
: tile windows
horizontally. : tile windows
vertically.
: tile windows
vertically. : Show related
windows
: Show related
windows : shows or
hides the Attributes tree.
: shows or
hides the Attributes tree. : shows or
hides the Attributes panel.
: shows or
hides the Attributes panel. : shows or
hides the Data grid.
: shows or
hides the Data grid.
…
Edit toolbar
 : search in Attributes
trees.
: search in Attributes
trees.…
Views toolbar
- : adds a new
view.
- : opens an
existing view.
- : saves
current view.
- : closes the
selected view.
- : exports
the report currently shown in the grid into a Microsoft Excel
worksheet.
 : custom sorting.
AND / OR: toggle button to switch between “AND” mode and an “OR” mode for filtering
Links configurator toolbar (see Links) 
- :
creates a new link.
 :
deletes the link.
:
deletes the link.- :
saves the link.
 :
renames the link.
:
renames the link. : reorders
all link windows
: reorders
all link windows : drop down list of all defined
links
: drop down list of all defined
links
Status bar and log file
A double click on the status bar at the bottom of the window will open the log file.
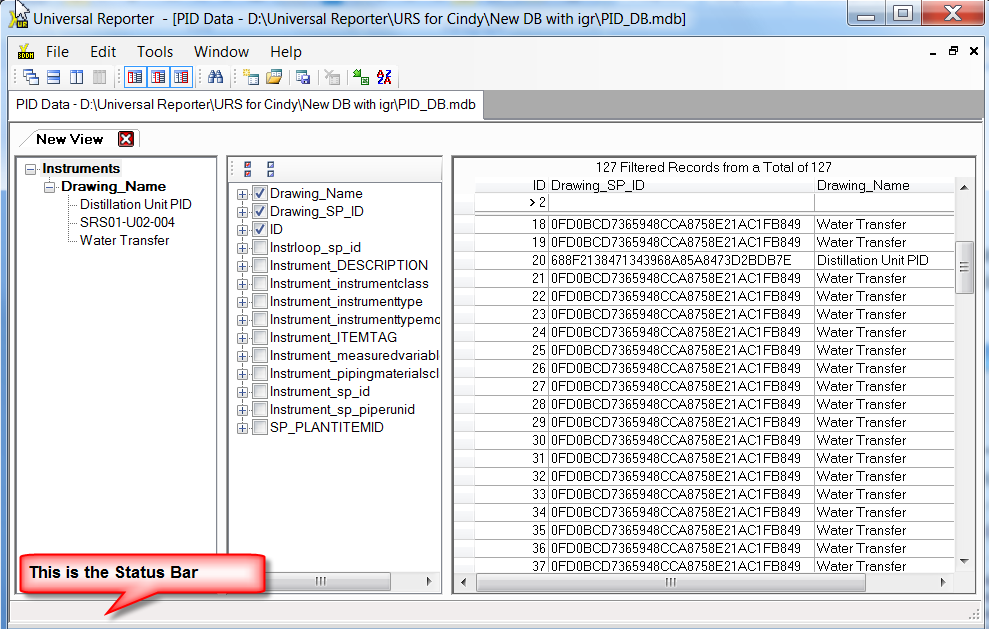
The log file can be found in the UniversalReporter folder of the temporary directory of the current computer.