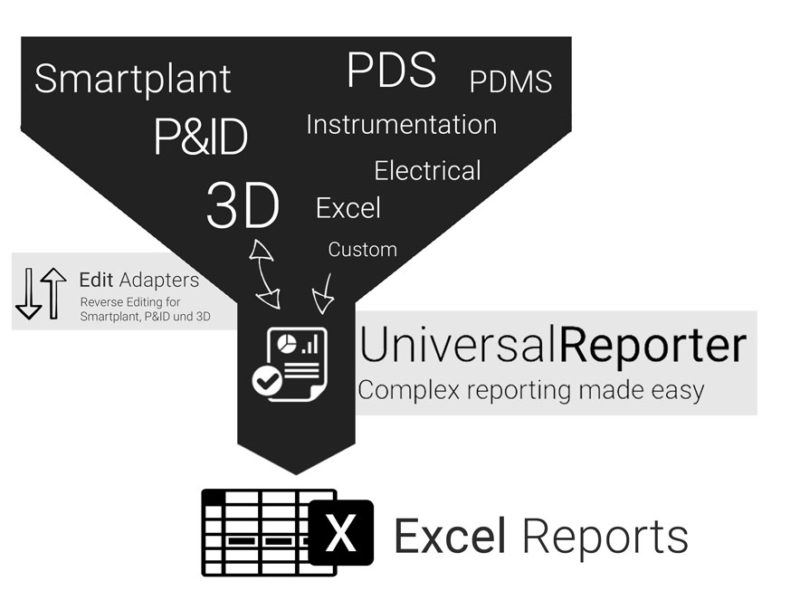
Complex reporting made easy
UniversalReporter provides a complete solution for reporting and supports different engineering systems
It is simple to use and allows you to also modify data and write it back to the P&ID or Smart 3D database
Easy to use
Empower your team to create complex report templates or to extract ad-hoc reports. No programming skills or deep system knowledge of the native applications are required
Need to change data?
You can modify P&ID or Smart 3D data directly in the GUI of UniversalReporter. For more complex modifications you can use the “Import from Excel” function which helps you to update the P&ID or Smart 3D model with data residing in external files.
All data in one place
Generate composite reports across multiple applications. Compare and validate all data in a single user interface.

Built to resolve key issues of reporting and data consolidation
Mostly, several systems are used for a single engineering project. Therefore, it is difficult to generate composite and comprehensive reports. Sometimes it even makes it impossible to verify changes in engineering content between two specific dates.
UniversalReporter is the quick and easy way to get the individual reports you need for your engineering projects. All you need are basic Excel skills. Even for complex requirements. Also when data checking and data consolidation is involved, UniversalReporter is the best choice to perform these tasks smoothly.
Easy engineering data reports
- Gain important insight into your data
- Use data from all systems for your reports
- Increase productivity and reduce man-hours
Use Cases
Explore the possibilities
Create a Smart 3D Piping MTO Summary Report
Challenge It is always a challenge to create a piping MTO report where all components are listed and summarized (per area, unit and/or pipeline system) with the appropriate associations to each pipe run, area, unit, etc. Solution 3D ReportAdapter adds the hierarchy information to the pipe parts: UniversalReporter can use the information on pipeline, area, unit, etc. to intelligently group your data This individually created report gives you a quick – up to date – overview of the materials used in your plant
- Extract data from the source application by using your own filter
- View data in UniversalReporter’s „Example Report for 3D Parts“
- Create piping MTO summary reports using a report template that includes built-in summary functions
Create a Smart 3D Piping Instrument List
Challenge
It is always a challenge to create an instrument list with the appropriate connections to the equipment or pipe runs, because the information is stored in different areas of the database.
Solution
The PID ReportAdapter sends the connectivity information to the offline instruments so that the connection to equipment, pipe runs, etc. is available for reporting
This type of report is very useful for downstream applications such as SmartPlant Instrumentation
- Extract data from the source application including the connectivity and process data information
- View data in UniversalReporter (check instrument connections and additional parameters)
- Create instrument list report
Update Smart 3D Equipment Data
Challenge
Data is stored in different locations/departments each having the ownership of parts of the data. Data must be imported in a controlled process to the Smart 3D application.
Solution
- UniversalReporter allows you to import external data into the familiar Microsoft Excel interface; the data can come from any other application or can be created manually
- UniversalReporter creates Excel reports which allow users with no access to Smart 3D to enhance and change 3D data
- Extract data from Smart 3D using the 3D ReportAdapter
- Receive Excel report from another department, including additional information
- Import additional data from the Excel sheet into the UniversalReporter
- Write imported data back to Smart 3D
Update Process Data for P&ID
Challenge
Data is stored in different locations/departments, each having ownership of its own data. The data must be imported in a controlled process to the SmartPlant P&ID application
Solution
- UniversalReporter allows you to modify source data using its Microsoft Excel interface; the data can be modified by users from different departments each adding their own information. It can then be imported into UniversalReporter
- Any changes towards the Smartplant P&ID application are tracked in a history file (history logging)
- In addition:
- Verification steps ensure all changes are applied correctly (e.g. check of code list values)
- Restricted data cannot be changed
- Changes are propagated to connected objects as defined in the rules
- Data changes are reflected via labels in the corresponding SmartPlant P&ID documents
- Extract data from the source application
- Add/modify technical parameters (from a Process Engineer perspective)
- Import the modified reports into UniversalReporter
- Write the changes to SmartPlant P&ID
Tutorial
Learn more about the UniversalReporter

By loading the video, you accept YouTube's privacy policy
Learn More
Create snapshot with PIDReportAdapter

By loading the video, you accept YouTube's privacy policy
Learn More
Reporting

By loading the video, you accept YouTube's privacy policy
Learn More
PID Highlights

By loading the video, you accept YouTube's privacy policy
Learn More
Find duplicate items

By loading the video, you accept YouTube's privacy policy
Learn More
Data editing

By loading the video, you accept YouTube's privacy policy
Learn More
PID Revision
Frequently Asked Questions
UniversalReporter uses Microsoft Excel to generate report templates. Initially the system generates an unformatted template file based on the content visible in UniversalReporter. Once this step is completed, all you have to do is to format the columns and rows using Excel in order to achieve the desired look and feel.
Most engineering staff are familiar with these standard Excel functions. With this approach, you can even create complex report templates with multi-line data or data on multi-pages quickly and easily. Also, ad-hoc reports can be generated in minutes without requiring a report writing specialist. Created templates can be saved for re-use, making workflows more efficient.
UniversalReporter can open data sources from multiple applications at the same time. This enables you to generate composite reports across applications and also to highlight object data on the P&ID and in the 3D model. This also allows you to validate the consistency of data that is held within the different systems (e.g. generate a Difference List Report between P&ID and 3D model data).
Find out what has changed. The snapshots created by the ReportAdapter can be opened simultaneously in UniversalReporter, and the difference list will mark the changes for objects which were added, deleted or modified. For P&ID data it is also possible to compare data based on the frozen revisions stored in the P&ID database (revision A versus revision B, or review X versus current content of the P&IDs).
It is often the case that data needs to be modified/consolidated for several applications. In the UniversalReporter grid, you can modify data coming from P&ID and Smart 3D and write the modifications back to the authoring applications. The write-back is executed via the original application’s API to ensure that all data is written back conforms to the application rules and the user’s application permissions.
A generic “Import from Excel” function simplifies the process of changing multiple items in one step; e.g. pressure and temperature values can be imported based on a fluid code or 3D equipment descriptions can be imported based on an external equipment list or based on data from the P&ID, etc.
Sometimes you may want to review the graphical objects that are linked to the resultant queries and reports. E.g. you may want to see the equipment, pipe run or valve on the P&ID, or in the 3D model. UniversalReporter allows access to any related P&IDs (highlighting the object in SmartSketch) and it will also find the object in the UniversalPlantViewer (assuming the model file is available).
UniversalReporter was designed to make it easy to compare, contrast and highlight data inconsistencies. It has built-in functions for counting objects, e.g. find duplicate equipment names, valve tags etc.. It also allows the user to identify pipe runs having the same tag, but which are not connected graphically or for identifying pipe runs which do not have a line label placed (P&ID only).
Another useful function allows the user to check if the attributes of the pipe runs connected to a pair of OPCs are identical.
For P&ID drawings, the user can also check:
- if they contain auxiliary graphics
- the number of versions for each drawing
- if a version is associated to the revision (for P&ID revisions)
Additionally, there is a Detailed Data Quality Module that allows users to check the quality of the data for specific naming conventions or design rules. This can be transferred onto the report in order to enforce corporate and project data management quality standards.
ReportAdapters and EditAdapters
connect to the source application database and extract data as a snapshot, which is then used by the UniversalReporter. EditAdapters allow the user to modify data and write it back to the source application via the source application’s API.
ReportAdapters are available for the following Intergraph applications:
- SmartPlant P&ID (EditAdapter available)
- SmartPlant Electrical
- SmartPlant Instrumentation
- SmartPlant 3D (EditAdapter available)
- PDS (EditAdapter available through “CopyMoveRotate”)
Additionally:
- In-house Microsoft Access databases can be used within UniversalReporter
- Excel files can be converted easily so that the content is displayed in UniversalReporter
Get started
Try or buy
UniversalReporter adds value to your organisation.
Try it out now. Request a free demo-licence
or
Purchase/Lease licences – we will find the best pricing model for you
Please contact us for either option at the CAXperts office.


