IntelliPID Module
IntelliPID is a module for UPV to show P&ID contents, including attributes and project hierarchy. The content is created in two steps:
Step 1 - creating the P&ID input for UniversalPlantViewer (.upvp file).
- By exporting data from Smart P&ID with CAXperts AdapterForSpid.
- By converting PDF P&IDs with the CAXperts AdapterForPdfPid.
Step 2 - creating a session with
UniversalPlantViewer Builder
- This can include P&ID information only, as well as
- Full 3D models with advanced linking between P&ID and 3D.
P&ID Navigation
|
|
“Go to P&ID” - When you select an OPC (Off-Page Connector), click this button to open the linked P&ID. The view zooms in on the OPC location in the P&ID. |
|---|---|
|
|
“Close all IntelliPID tabs” closes all currently open IntelliPID P&IDs and removes them from the tab bar. All unsaved sketches, markups and coloring will be discarded. |
Legend
The legend provides color code information for the custom attribute selected from the drop-down described above. The unused values can be hidden with the function “Show only active”. The displayed (unhidden) colors and according values will be shown in the placed legend as described above accordingly.
File Menu
|
|
“Select display style” opens a pop-up menu for display style selection. Your model is loaded with a default color file, but additionally, you can load coloring settings depending on attribute conditions defined in color files. To revert to default colors, use “Reset Color”. |
|---|
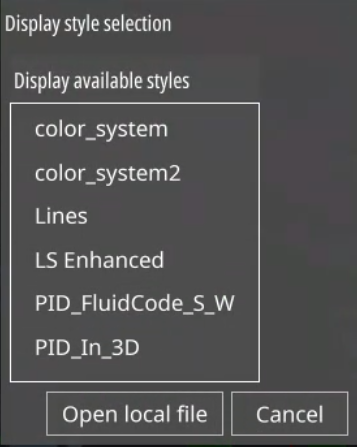
Depending on the settings in the upvcolorindex.txt file, you’ll see a list of custom-defined display styles. To open files not listed, click on “Open local” to access them directly from your file system.
If you select a display style with color groups, you can choose which color groups to activate.
To create custom color files using Excel, enter a color and a condition. For more details about the settings and definitions, refer to the section [Color Files] in the Chapter [Custom settings].
|
|
“Place legend” - A legend according to the settings in your color file can be placed on the P&ID. For more details, see the section Colour Files in the chapter Custom settings. |
|---|---|
|
|
“Create report” - This opens the report creation dialogue. Predefined custom and ad-hoc reports can be generated here. For more details, see the Chapter Reporting. |
|
|
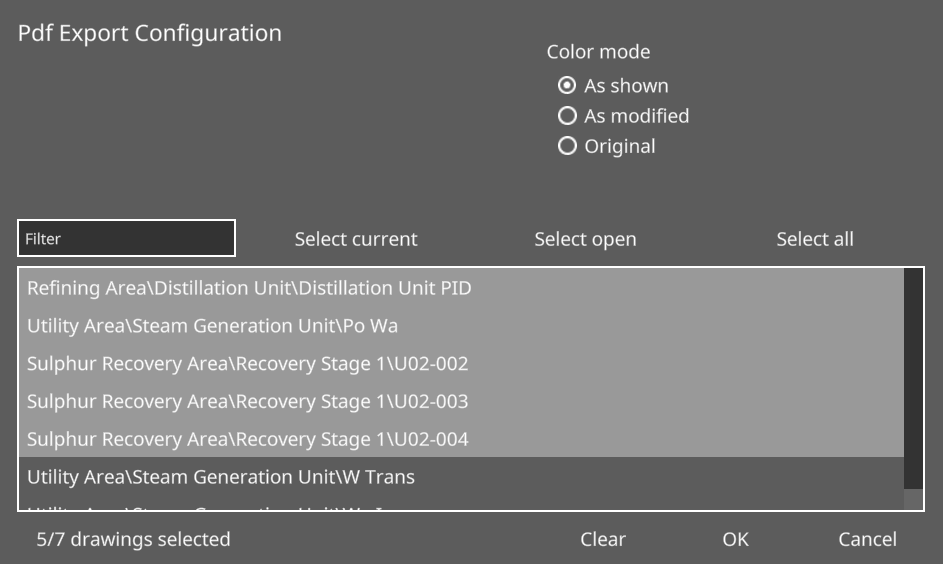
“Export to PDF” - Opens a file save dialogue for saving IntelliPID P&IDs to the PDF format. Several options are available for the PDF Export (see image on next page): |
“As shown” - The P&ID will be exported as displayed, including selection highlighting.
“As modified” - The P&ID will be exported as displayed, selection highlighting is ignored.
“Original” - The P&ID will be exported in its original state, all coloring being ignored.
Additionally, a P&ID name filter can be applied to the list of available P&IDs. You get to select from this list using four selection options:
“Manual selection” - Click to select individual P&IDs, and hold down the Ctrl key to enable multiple selections.
“Select current” - Click to select only the currently displayed P&ID.
“Select open” - Click to select all P&IDs currently open (visible in the tab bar at the bottom).
“Select all” - Click to select all P&IDs in the project.
|
|
“Load link file” - Click to open a file system dialog to load a link file (.xlsx). For more details about the formatting and definition of links, refer to Link mapping files in the Chapter Custom settings. |
|---|---|
|
|
“Open manual” - Click to open this manual directly within UniversalPlantViewer. |
Files Panel
|
|
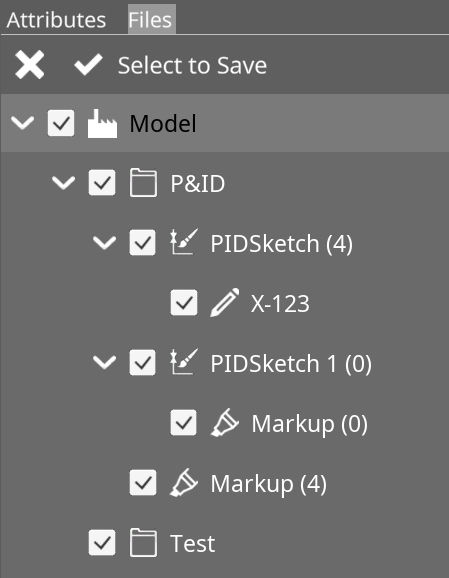
Save - Click to initiate the save options, as depicted
in the image below. Select tree elements individually for saving.
Deactivating a folder object disables all objects within its hierarchy.
Upon confirmation, a file save dialogue will prompt you to choose a file
name and location. Remember, the file type should be .upvf. |
|---|
Confirm the elements to be saved with
[![]() ] or
cancel the saving process by clicking
[
] or
cancel the saving process by clicking
[![]() ].
].
|
|
“Open” prompts a file open dialogue to select an .upvf file for loading. The loaded file is automatically integrated into the file tree hierarchy. If replacing, remove the existing hierarchy first. |
|---|
Double-clicking an object’s icon opens it directly, even in 3D. The corresponding P&ID opens automatically, and the viewport switches to the IntelliPID view.
Context Buttons
All objects feature context buttons located to the right of the file or object node. These buttons offer various functions depending on the type of file or object. They become visible when hovering over the respective node with the mouse or when the object is clicked on.
Context Controls
|
|
“Show/Hide” - This checkbox toggles the visibility of the corresponding file or object in the viewport. |
|---|