QualityAssuranceModule
QualityAssuranceModule is designed to configure and apply quality checks that assure the quality of project data. The QualityAssuranceModule is used to check data in MDB files. Quality assurance filters can be defined to check data and to show inconsistencies. The result of these checks can be exported to Excel.
Prerequisites
Supported operating systems:
Microsoft Windows XP
Microsoft Windows Server 2003
Microsoft Windows Vista
Microsoft Windows 7 or later
Microsoft Office 2003 or later
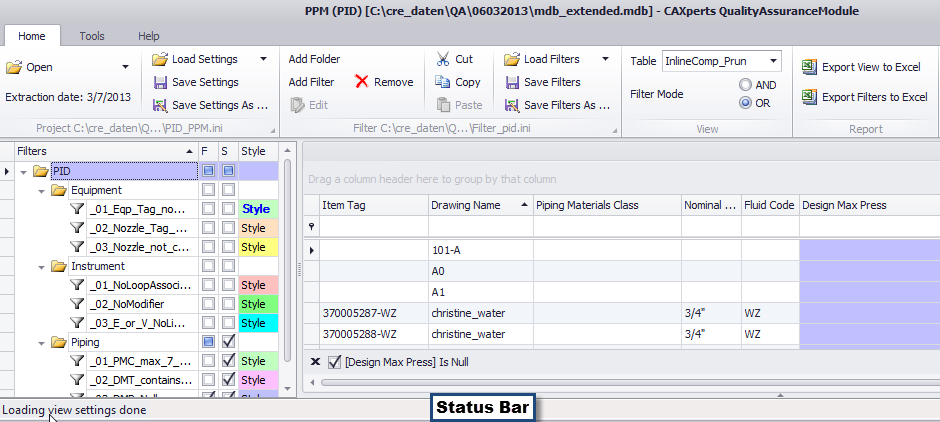
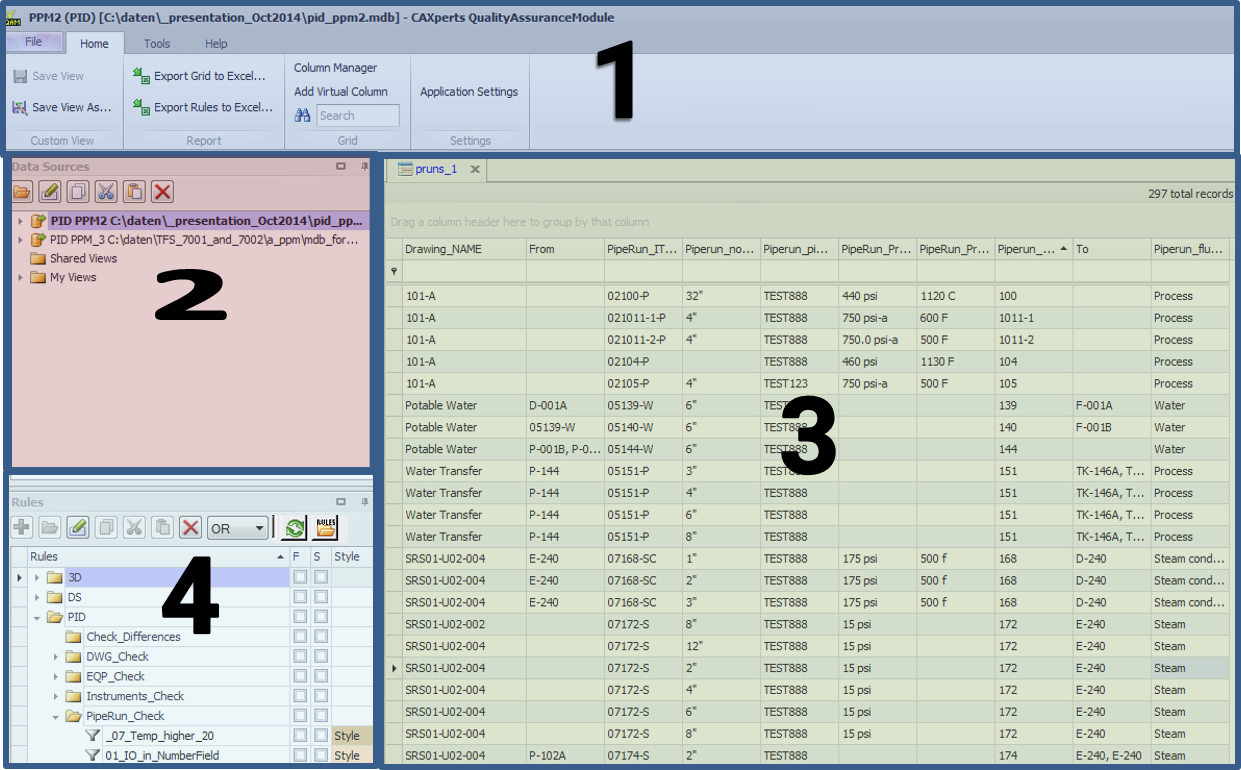
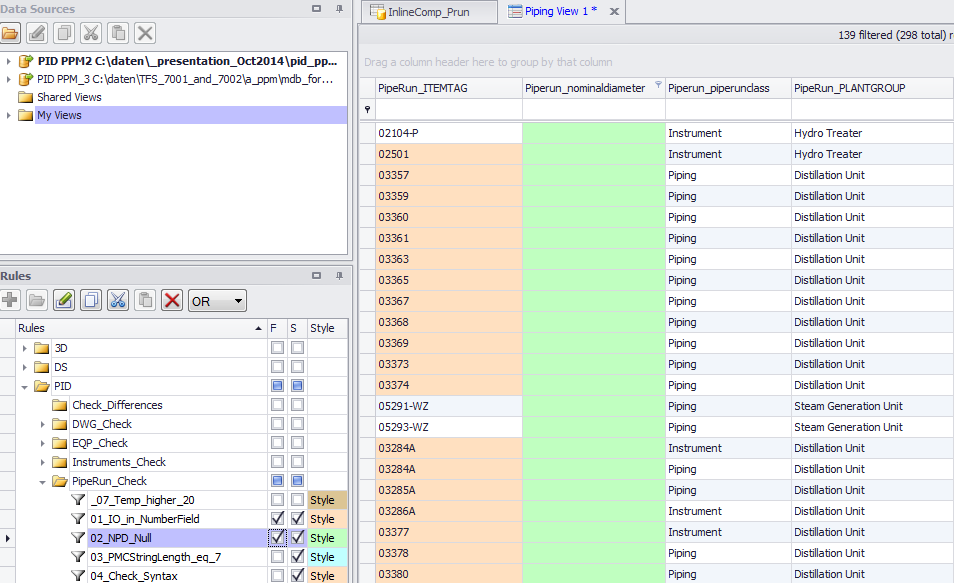
This is the menu bar. It is grouped in File, Home, Settings and Help in the menu bar.
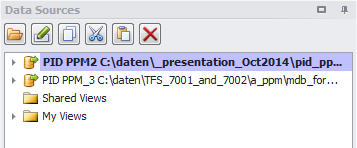
This is the DataSouce area where mdb files can be selected and opened and where the views are defined (Shared Views and MyViews)
This is where you see the Data Grid.
This is where the filter definitions are. It is a hierarchical tree, in Manual known as filter tree.
Open a project
.mdb files can be opened using Openproject in the data source area.
In the title bar the Plant name (PPM), Application name (PID) and the name of the mdb file are displayed. For the SmartPlant P&ID, SmartPlant Instrumentation, SmartPlant Electrical and Smart 3D extractions all tables defined in the “Task” table in the Mdb file are available for selection.
In case the Access file was not created using CAXperts ReportAdapters only the name of the Access file is displayed in the title bar. In this case all tables and queries from the Access file are selectable.
Open a table
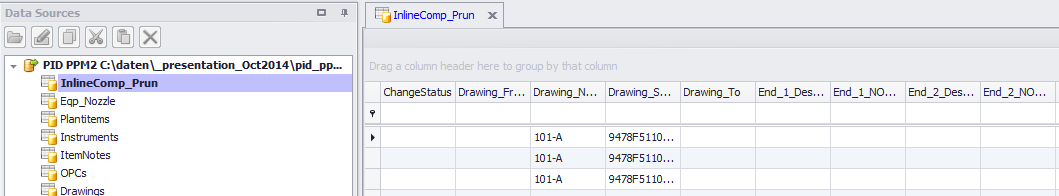
To open a table or switch to another table, click in the Home tab on Table and select the table you would like to view. The names of the tables depend on the application (PID, INS, 3D etc.) and also on the definitions done in the Application ReportAdapters. For more details please view the manual of the corresponding ReportAdapter.
Double-clicking on a table in the data source area will open the table in the data grid.
Create a view
Views are used to store the specific configurations of tables (selected columns, virtual columns, filters which are applied etc.).
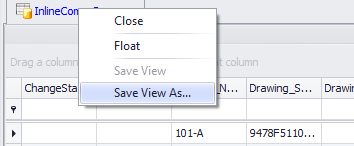
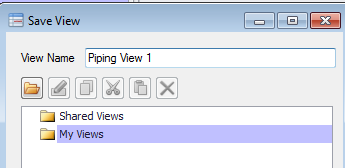
Views can be stored using Save Views as right clicking on the table name in the data grid. The user must choose if he wants to save the view in the My views or Shared views folder.
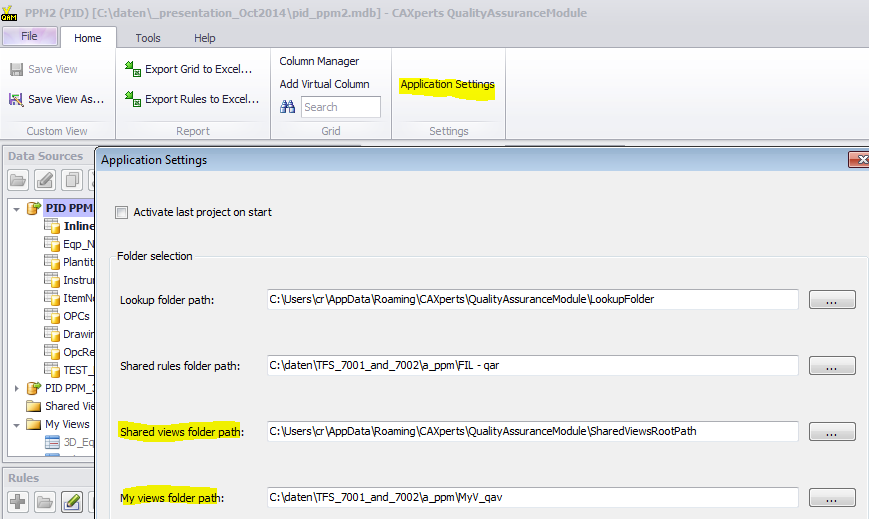
The paths where the views are stored are defined using the Application settings button in the Home menu commands.
1) The view files are called “.qav” files (Quality Assurance View files) on the file system. 2) The rule files are called “.qar” files (Quality Assurance Rule files) on the file system.
Working with the data grid
Working with views
Changes as described below can be applied to the views. In order to save the view the user can click with the right mouse button on the view and use the Save view command.
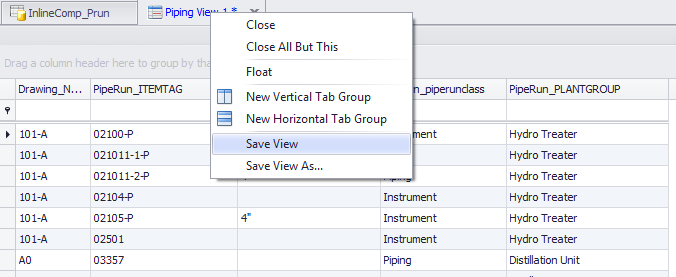
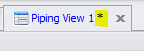
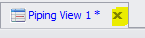
The asterisk in near the name of the view will be displayed as long as the view has been changed but not yet saved. It will disappear after saving the view.
If the user does not want to save the changes he can close the view and select No when asked if he wants to save the changes.
Manage columns
Order of columns
The order of columns can be changed through drag & drop of column headers with the left mouse button. Click and hold on a column you want to move until you reach the new position with the cursor and release the click.
Sorting
Click on a column header to sort the data grid depending on this column. Click once more to toggle between ascending and descending sort.
Grouping
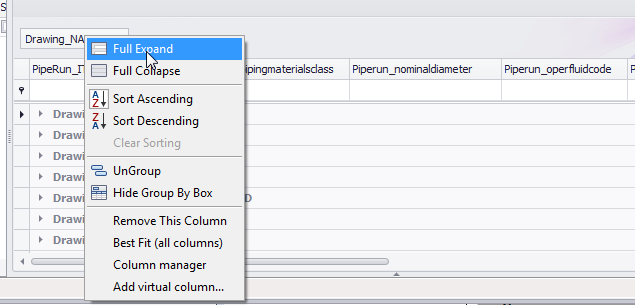
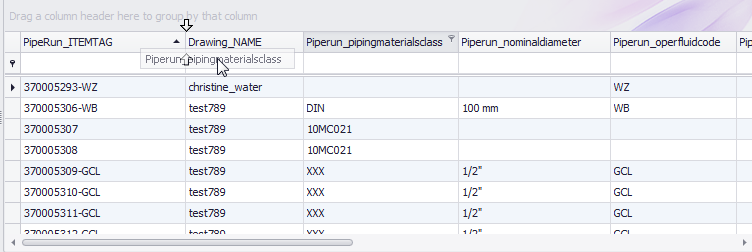
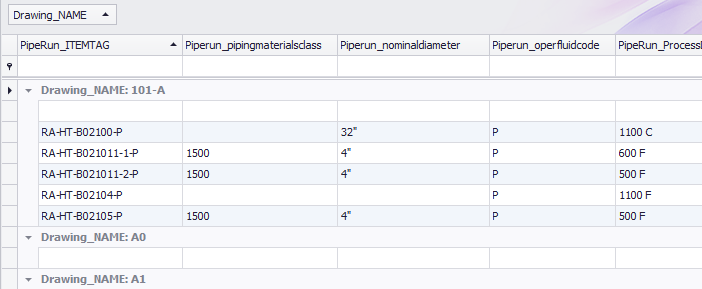
You may drag & drop column headers to the dark grey area above to group by these columns. The order may be changed via drag & drop. If you group data in a grid by a single column, records with identical values in the same column can be arranged into corresponding data groups. Each data group is identified by a group row, which you can expand to access its underlying data rows. If you then group data by another column, data rows within each group are combined into second level groups according to values of the new group column. Using the context menu item Full expand on the GroupBy attribute will show the grid in an expanded mode (as in the example below). The grouping can be cancelled by dragging the attribute back to the list of columns.
Hide columns in grid
Right click the column bar and click Remove this column or Column manager (for multiple columns). To change the visibility un-/check the checkbox in front of the column name.
Add virtual columns
A virtual column is not bound to any field in a data source. You can provide data for virtual columns by specifying a formula (string expression) used to automatically evaluate values for this column.
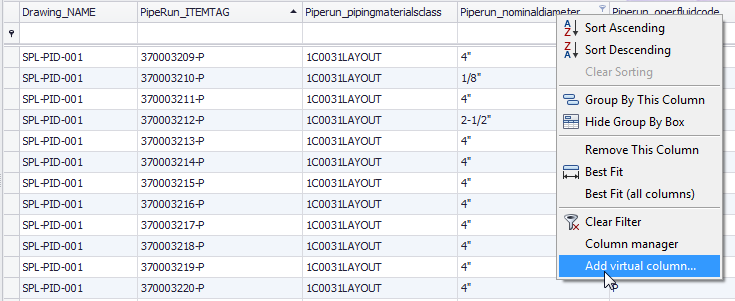
Right click any column name and click Add virtual column…
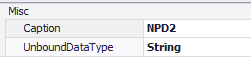
It opens the Expression editor to allow you to specify an expression for the column. First the name of the new column and the data type must be defined. The data type can be selected from a dropdown list.
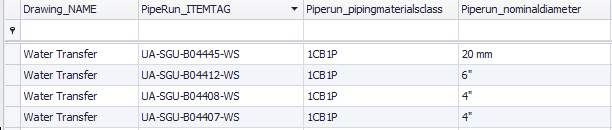
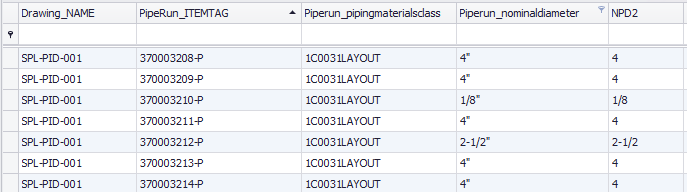
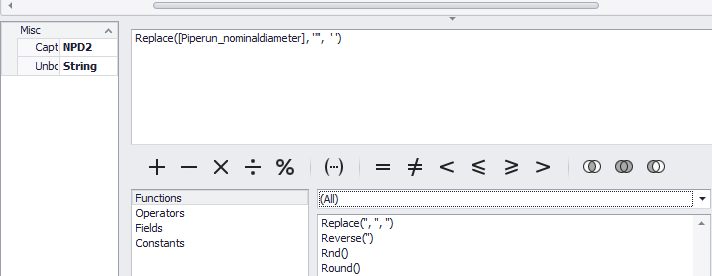
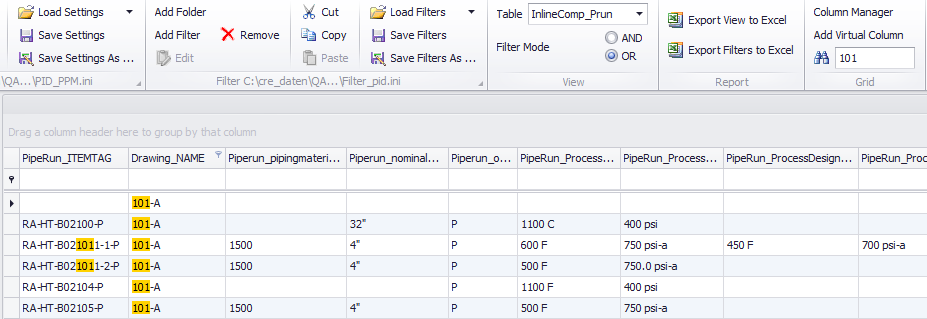
The following example shows how to create a virtual column (NPD2). Data for this column is calculated according to the formula: Replace([Piperun_nominaldiameter], '"', ' ')
Edit virtual columns
Right click on the virtual column you want to edit and click Edit virtual column…
Remove virtual columns
Right click on the virtual column you want to remove and click Remove virtual column….
This command will remove the virtual column from the Data grid. If the command Remove Column is used on a virtual column the column will remain available and can be activated later using the Column Manager.
Search function
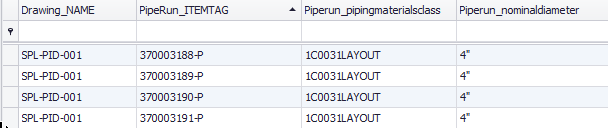
When searching with the grid search function only records that contain the entered search string are displayed. If the serach string is cleared the grid will display all records.
Filtering in the data grid
Filtering allows you to display a subset of the records in the data source that meet a particular criterion. When filtering is applied to a Grid View, displayed records are restricted to those that meet the current filter criteria. You can filter data against single or multiple columns. You can apply filtering by selecting a column's value from the filter dropdown, typing in directly in the automatic filtering row or building a filter via the filter editor. For more information about working with filter editor see the chapter “Manage quality assurance (quality assurance) filter”.
To get a selection of values which exists in this column hover with
your cursor over the column name,  icon will show up and click
on it.
icon will show up and click
on it.
Filtering using the filter dropdown
Right click on a column and select the filter icon.
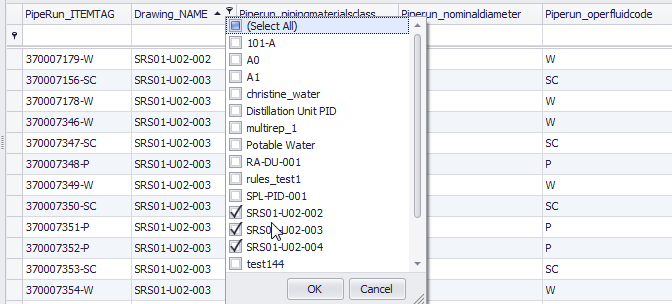
You will see a dropdown list of all the distinct column values, in the list you can select all values, only one value or a list of values as seen in the screenshot below.
Filtering using the automatic filter row
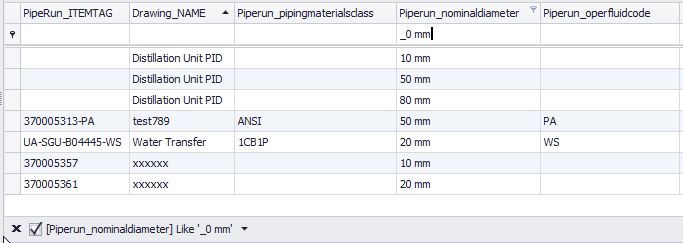
The automatic filtering row is displayed at the top of a View and allows data to be filtered on the fly - by typing text directly into a row. If you type text within a row, a filter condition is automatically created based upon the values entered, and this is applied to the focused column.
Filter expression examples
To show only records where the field value begins with “12”, enter: 12
To show only records where the field value ends with “in”, enter: %in
 To show records where the
field value equals 10, 11, 12, … 19, enter 1_
To show records where the
field value equals 10, 11, 12, … 19, enter 1_
Manage quality assurance rules
Working with quality assurance rules
Filters can be created directly in the topmost directory or they can be created in folders. We recommend to create application specific filter files (for SPI, SPPID, SP3D, PDS etc.). However it is possible to keep all filters in one file, even if this is not recommended.
Create quality assurance rule
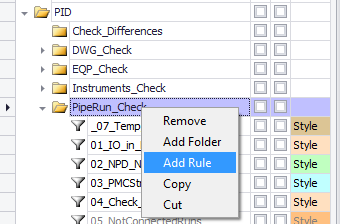
To create a quality assurance rule, please click on Add rule or right click in filter tree and select Add rule. After a new filter is created the edit filter panel will be shown.
The Rule Editor allows you to build complex filter criteria with different filter conditions, combined by logical operators. The Rule Editor contains two tabs providing the Visual or Text-based rule editing style.
Rule definition in visual mode
The Rule Editor displays filter criteria as a tree structure, where
nodes represent simple filter conditions. If the filter criteria consist
of multiple filter conditions, the Rule Editor contains multiple nodes
linked by logical operators into groups. You can select And, Or, Not
And, Not Or to change the operator. Click “ ” to add a condition to your
group of operator.
” to add a condition to your
group of operator.
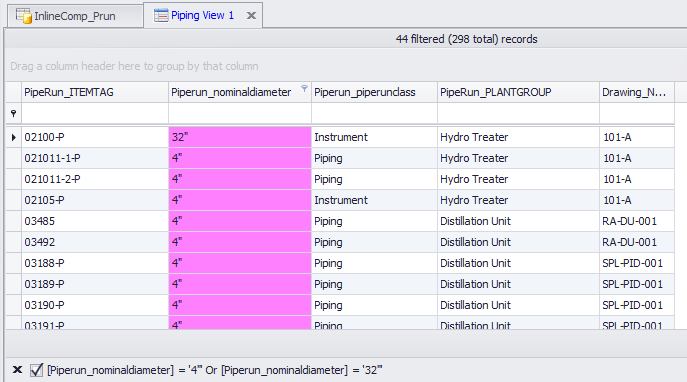
The following example looks for piperuns having NPD 4” or 32”.
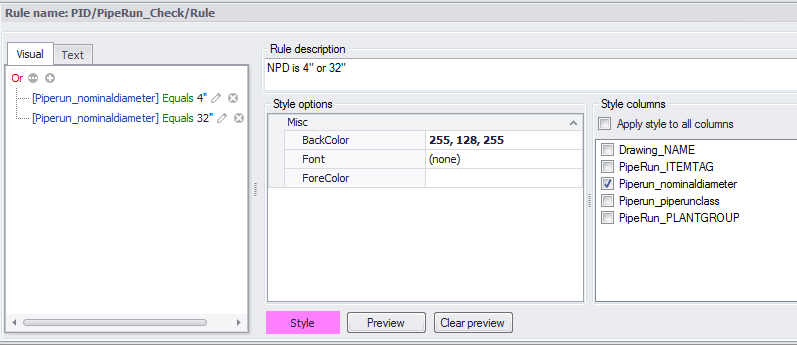
In addition to the rule query definition a description and a style (background colour, font) can be defined for each rule (the style will be applied to the grid).
The Preview command will apply the filter and style to the grid so that the user can test the result.
The style consists of BackColour (colour if the cell in the grid), Font (TextFont for the data in the grid) and ForeColour (colour of the data in the grid); the style can be applied to one or more columns (ev. also to all columns) in the grid.
Cancel preview will remove the filter and style from the grid.
OK will save the filter and close the filter editor.
Cancel will close the filter editor without saving the filter.
Rule definition for attributes with select list
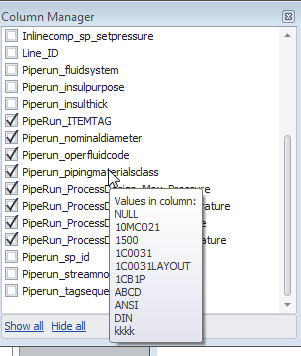
For attributes with select list it is possible to open the content of the select list (right-mouse-click on the value field):
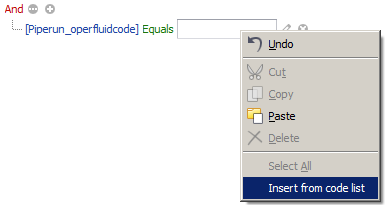
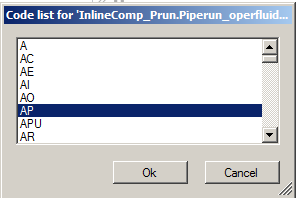
This makes it easy to create rules for attributes which have a select list (e.g. check if all pumps have a tag prefix “P” etc).
Rule definition in text mode
In text mode the filter conditions are displayed as text; it is mandatory to use this mode for filters that will use functions like Substring, Replace, Len etc.
The next example shows a rule which is checking if the length of the Piping Materials Class does not equal 7 Chars.
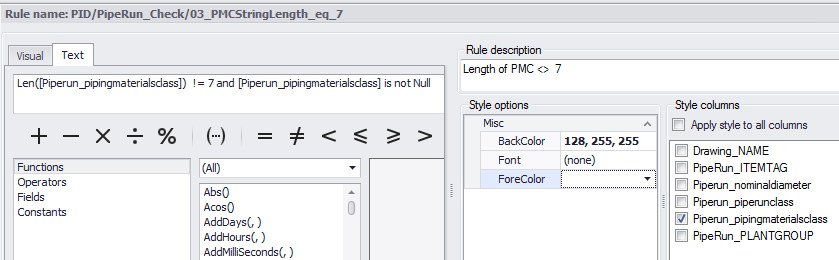
Rules which use functions cannot be displayed in Visual Mode, if the user tries to activate the visual mode the following a message will display that the rule cannot be displayed in visual mode.
Check functions against Access files and Excel sheets
Three functions have been added which allow checking the values from the grid against external files:
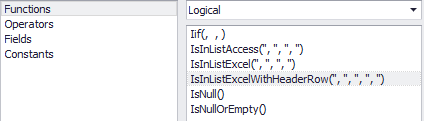
IsInListAccess checks against another Access file (mdb or accdb).
IsInListExcel checks against an Excel file using the Excel column names in the search function.
IsInListExcelWithHeaderRow allows the user to define which Excel row contains the header columns and these are used to check the data.
Example:
IsInListExcel([Equipment_ITEMTAG], 'C:\\data\\_QA\\_Test5\\Equipment_Tags.xlsx', 'test', 'A') == True checks if the values from the grid column “Equipment_ITEMTAG” exist in the Excel Worksheet Sheet name “test”, Column “A”.
IsInListExcel([Equipment_ITEMTAG], 'C:\\data\\_QA\\_Test5\\Equipment_Tags.xlsx', 'test', 'A') == False checks if the values from the grid column “Equipment_ITEMTAG” do not exist in the Excel Worksheet Sheet name “test”, Column “A”.
Apply quality assurance rules
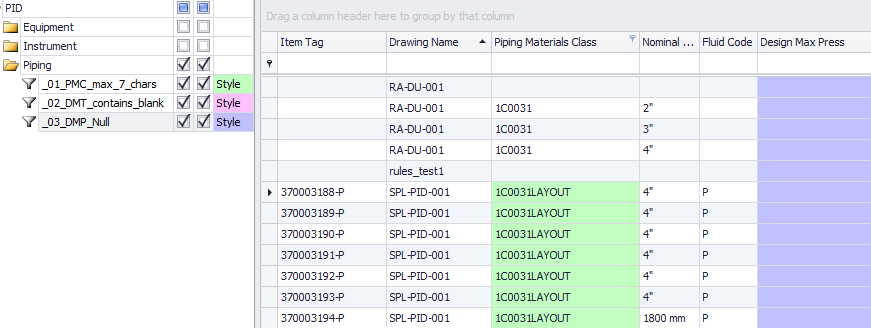
There are multiple possibilities how rules can be applied: Apply Filter and/or Style, apply multiple filters with / without styles, combine the filters with Or / And etc.
Click the checkbox below “F” to activate the filters, and the checkbox below “S” to activate the styles.
Filter mode
Filter mode defines how quality assurance filters are joined which each other in case more than one filter is enabled in filter manger. The default filter mode is “Or”.
To change the filter mode please click on AND or OR.
Rename quality assurance rule
To rename a filter please click on the rule name. The cursor will start to blink and you will be able to rename the rule.
Modify (edit) quality assurance rule
To modify a rule please click on Edit in menu bar or
right click in filter tree on the ruleand click Edit or
click on the  icon near rule and the edit
rule panel will open.
icon near rule and the edit
rule panel will open.
Delete quality assurance rule
To delete a rule please click on Remove in menu bar or right click in rule tree on the rule and click Remove.
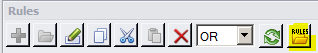
Refresh quality assurance rules
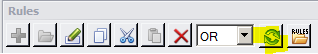
The Refresh rules command will read the rules from the file system and refresh them within the QualityAssuranceModule; if rules are copied and modified on the filesystem this command can be used to have access to the modified/added rules without closing and reopening the application.
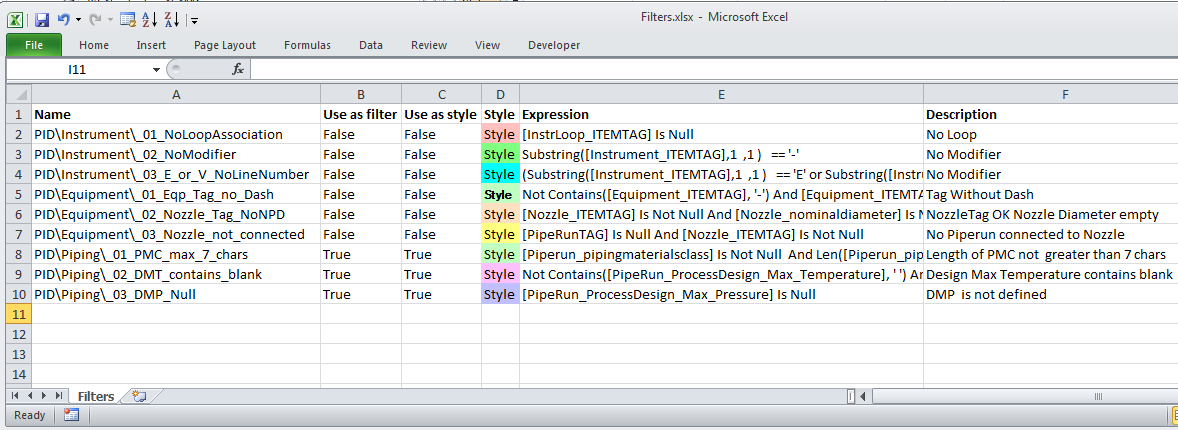
Import quality assurance rules
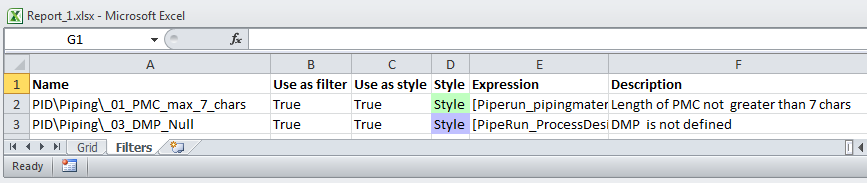
The Import rules command will import a set of rules from an Excel sheet. The sheet must be created with the Export Rules to Access command (or have the same format as the one created with this command).
This allows the user to store different rule configurations and to transport them from one project to another or from one environment to another.
The content of the sheet is displayed below (sheet name must be “Rules”):

Working with folders
To group multiple filters, create a folder and move (See Reorder folder) the filters inside it.
Add folder
To add a folder click on Add folder in the menu bar or Right click in the filter tree and click Add folder.
Reorder folder
To add a filter to a folder you can use drag and drop or select the filter and click Cut in the menu bar or right click in filter tree on the filter and click Cut. Select the destination folder and click Paste or right click the destination folder and click Paste. If you want to duplicate the filter use Copy.
Delete folder
To delete a folder please select the folder you want to delete and click Remove in menu bar or right click in filter tree on the folder and click Remove.
Working with application settings
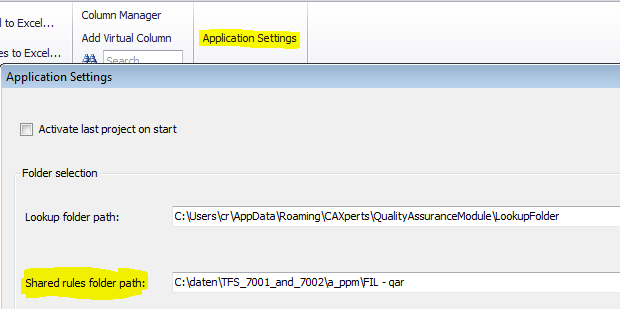
The application settings menu allows defining the folders for:
lookup tables (mdb files)
path for shared rules
path for shared views
path for My Views
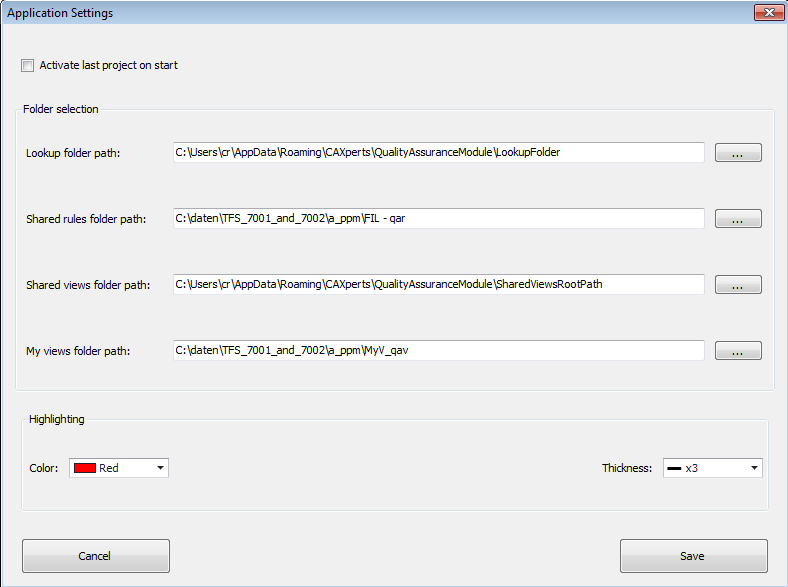
Activate last project on start
In addition it is possible to check the “Activate last project on start” checkbox. In this case the project which was active when the user closed the application will be activated the next time the user starts the application including all the views which were open.
Highlighting
Allows choosing the highlight colour and thickness factor. These will be applied when data is highlighted with SmartSketch and when it is saved as PDF.
Reports
Reports without template
Export grid to Excel
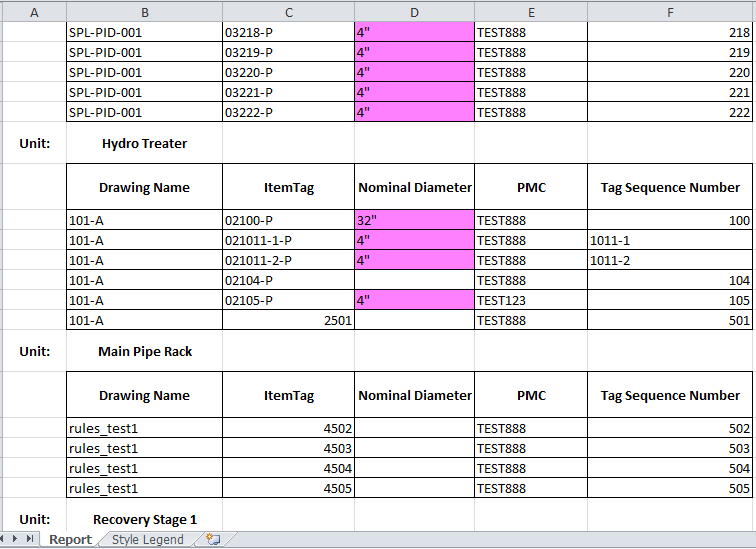
This creates an Excel report of the grid including all settings (active filter, sorting, style, column size, …).
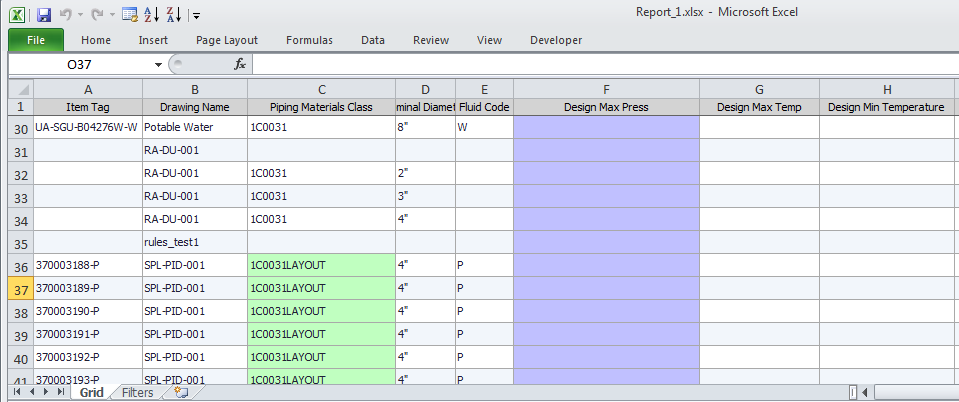 The example above shows the
content of the grid exported to Excel.
The example above shows the
content of the grid exported to Excel.
 The sheet “Grid” contains
the exported data.
The sheet “Grid” contains
the exported data.
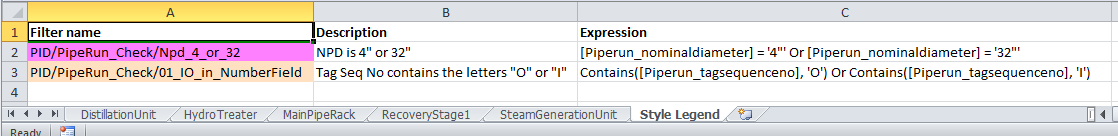
The sheet “Style legend” contains the list of applied rules including the rule conditions.
Export rules to Excel
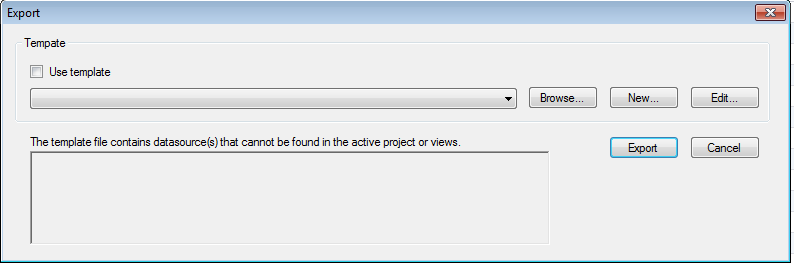
Reports with template
If the user wants to create reports with additional formatting, logos, grouping of data etc. he must use the option “Report with template” and create report templates which will have additional formatting.
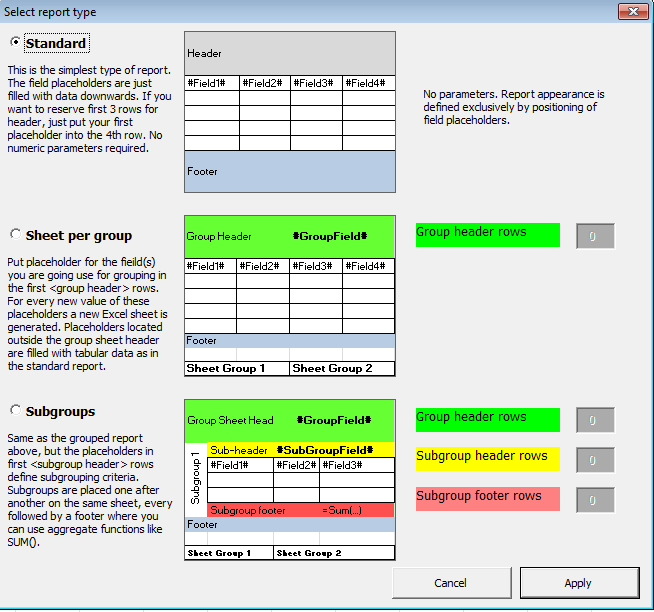
There are 3 possibilities for creating report templates:
Standard: all data will be placed on one sheet
Sheet per group: each new value of the “GroupField” will generate a new sheet in the report
Subgroups: for every new value of the “SubGroupField” the data will be listed as for the standard report (on the same sheet); in combination with the “GroupField” additional sheets can be generated
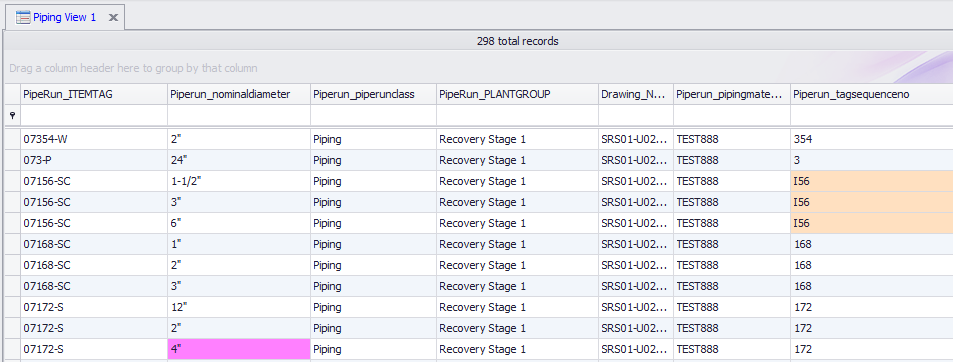
Example for creating a “Standard” report (from the view “Piping View 1”)
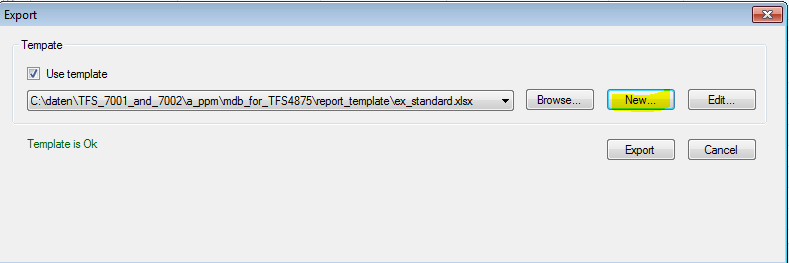
Using the “New” button for Create Report choose a folder for the template and give it a name.
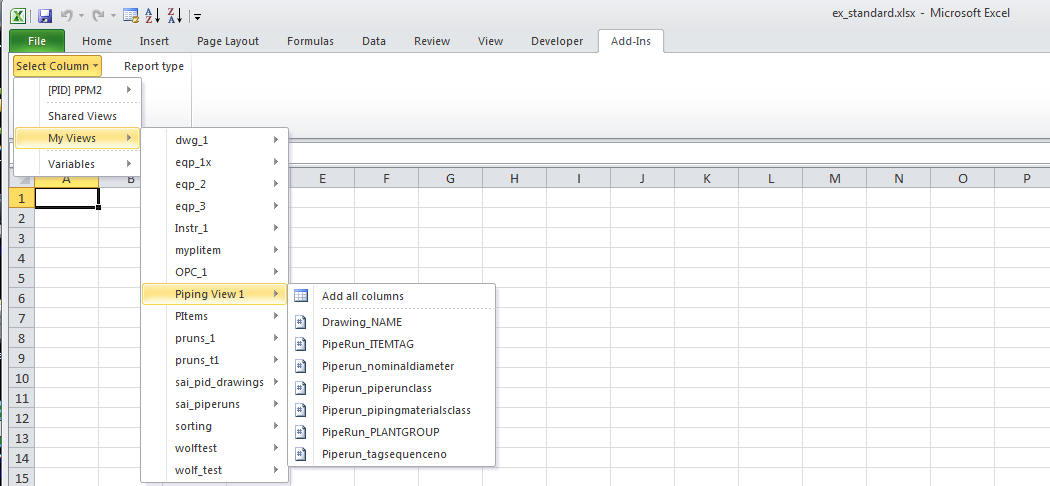
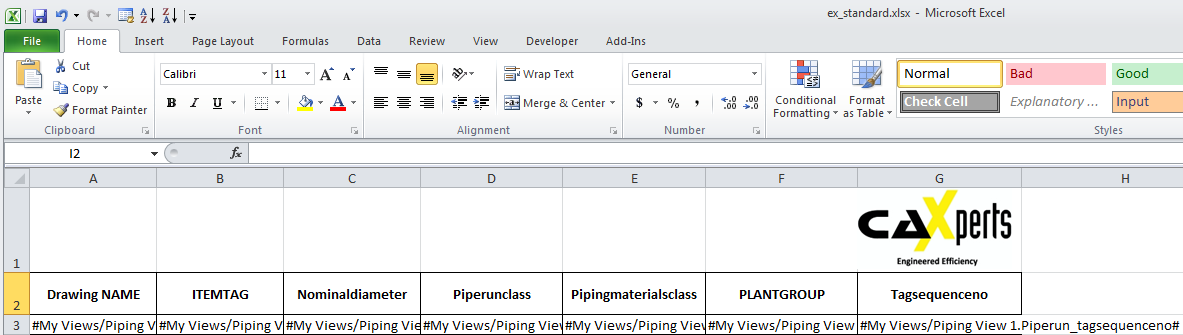
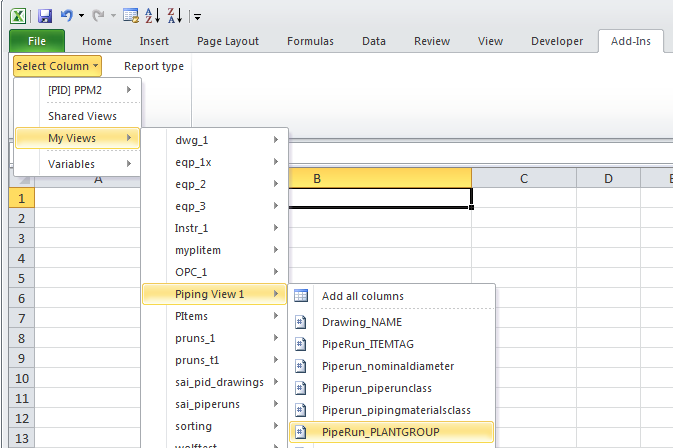
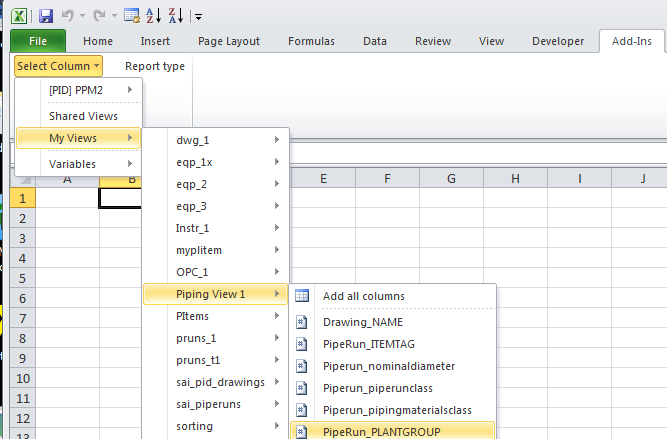
Then use “Edit” to edit the report and define the fields. The fields can be defined manually (one by one) but there is also an option to place all the fields which are visible in the view on the report (using Add-Ins / Select Column and then choosing the <ViewName> / Add all columns function):
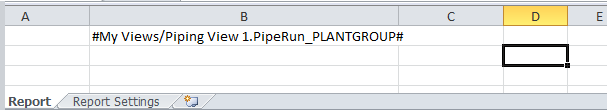
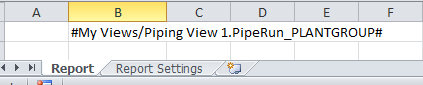
The data will be placed by default on the first Excel row.
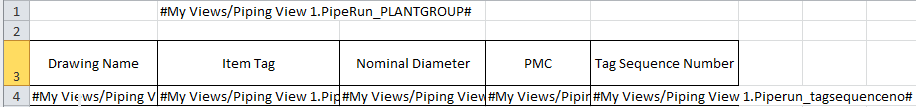
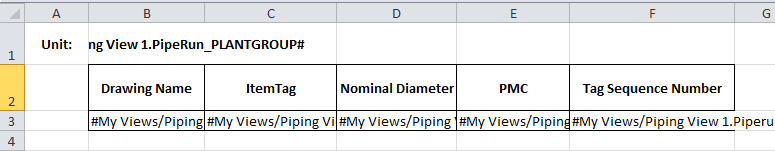
In the example below a new line was inserted, the logo was inserted using the Insert Picture function in Excel and the Header information was renamed.
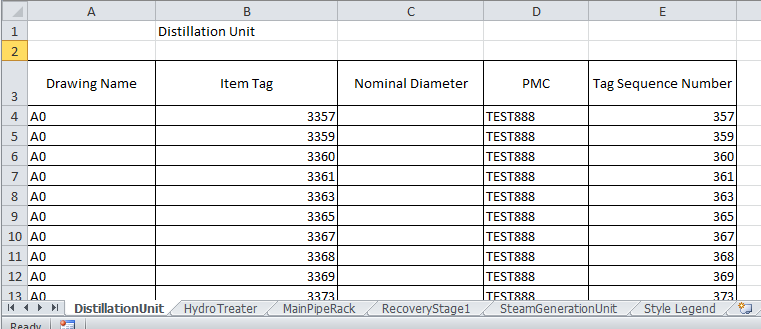
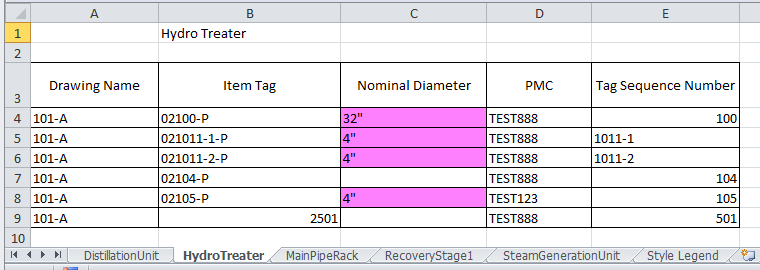
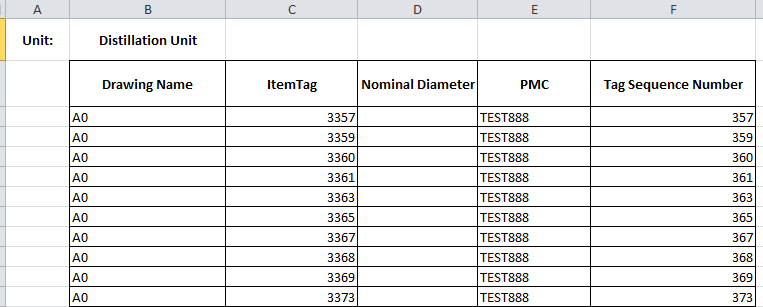
The result when using the template:
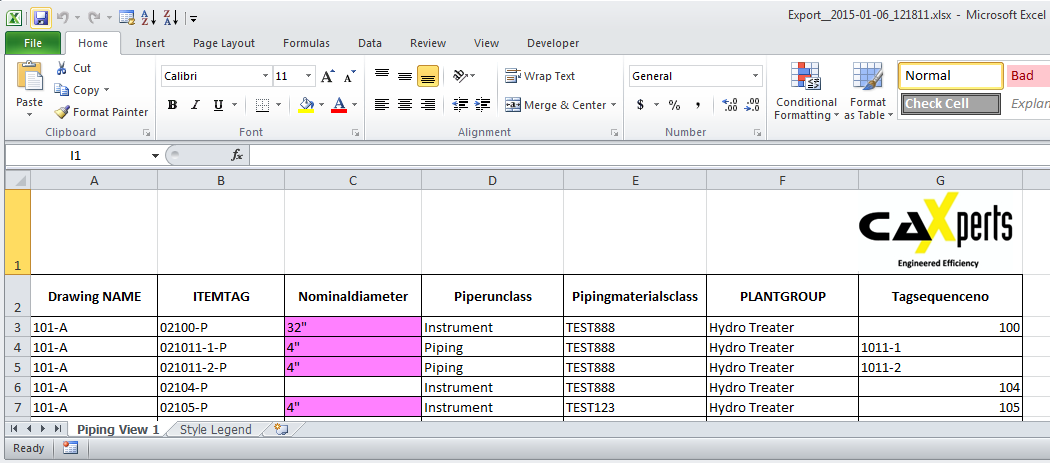
The data is displayed on a sheet having the same name as the View.
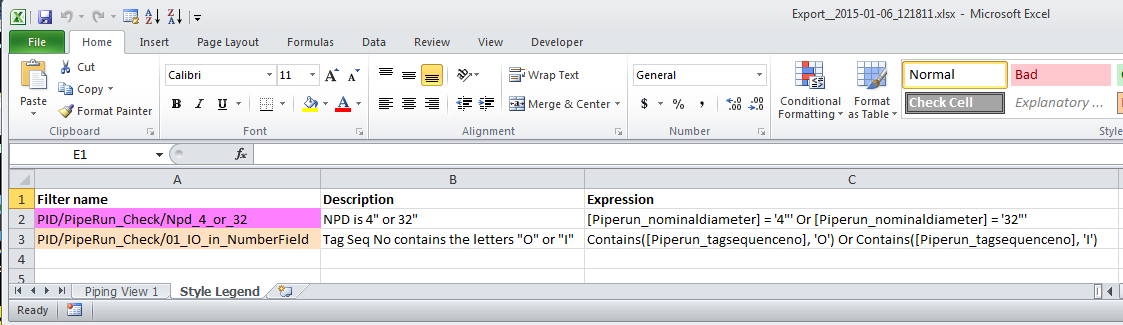
The rules which have been applied are displayed on a sheet called “Style Legend”.
Example for creating a “Sheet per Group” report
This example will use the “PlantGroup Name” as field for grouping the data and will display the data related to the different plantgroup names on different sheets.
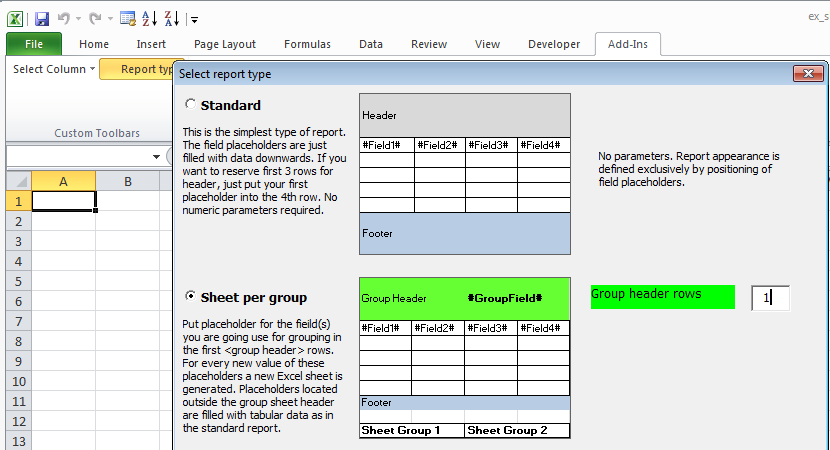
Choose the report type and select the row which will contain the group field.
Select the position for the group field and choose it using Add-Ins /Select Column
Place the other fields including the header row in the next rows.
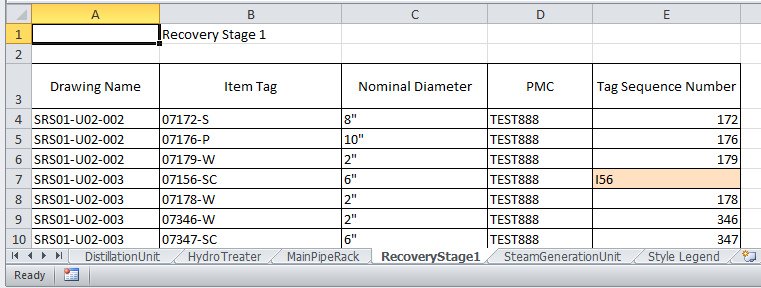
The result will place each distinct PlantGroup Name with the related data on a new sheet:
The last sheet is the style legend sheet:
Example for creating a “Subgroups” report
This example will use the “PlantGroup Name” as field for subgrouping the data and will display the data related to the different plantgroup names grouped by the distinct plantgroup names on the same sheet.
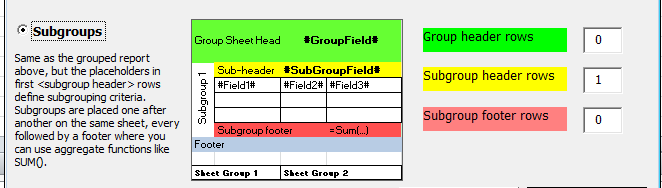
The field which is used for grouping is placed in the first row.
The other fields need to be placed below including the header row.
The result: all the data is displayed on the same sheet and is grouped by the plant group name.
It is also possible to use a combination of Grouping and Subgrouping if the parameter “Group Header Rows” is also used. In this case new sheets will be created as explained in the example “Sheet per Group”.

The parameter “Subgroup footer rows” allows creating a sum of values for instance sum of gate valves per unit or sum of pipe length per unit.
General notes concerning view files and reports:
Graphical functions (for PID only)
If SmartSketch is installed then the following functions are available in the data grid:
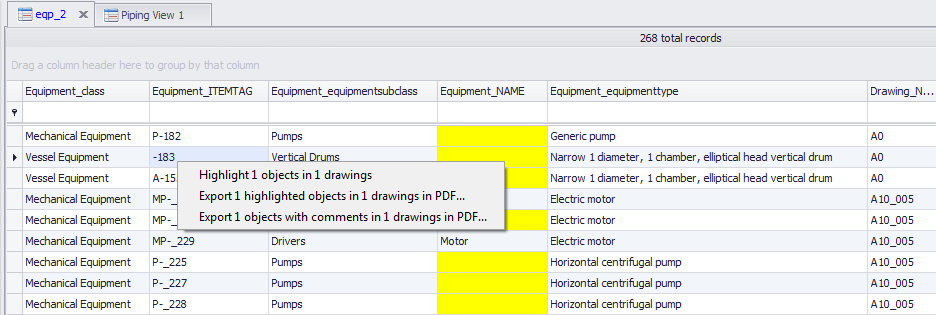
Highlight data in drawing
The function “Highlight n objects in drawings” will open SmartSketch and show the marked object(s) in the Highlight Colour and LineWidth Factor.
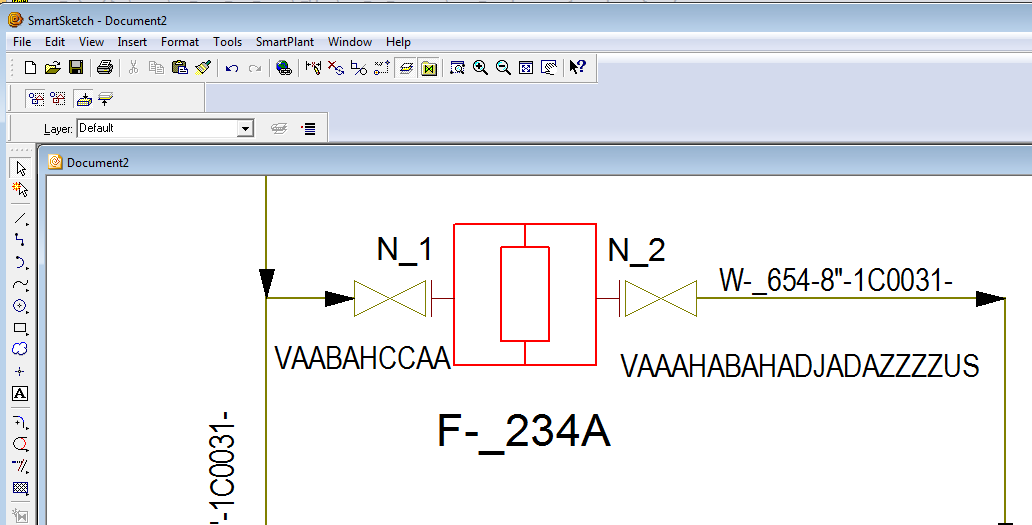
If there is more than one drawing involved they will all open and display the selected objects in the corresponding Highlight Colour and LineWidth Factor.
Export highlighted objects to PDF
This function will convert the drawings to PDFs (including the Highlight Colour and WidthFactor for the selected objects).
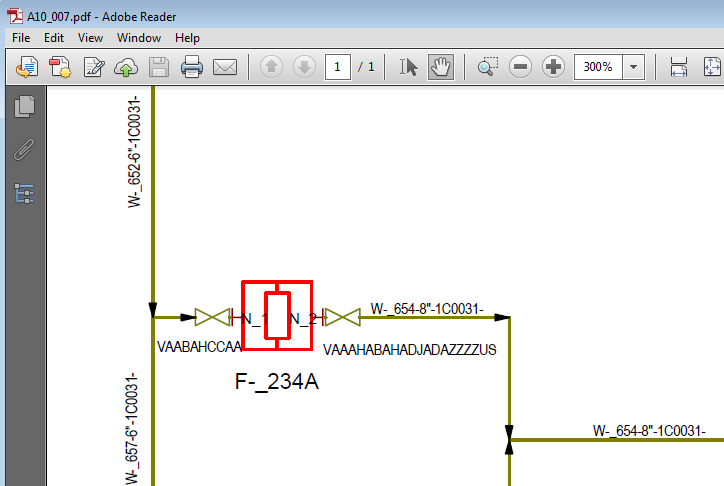
Export objects with comments to PDF
This function will place comments on the PDF files around the objects where problems were identified by the rules which are applied to the grid.
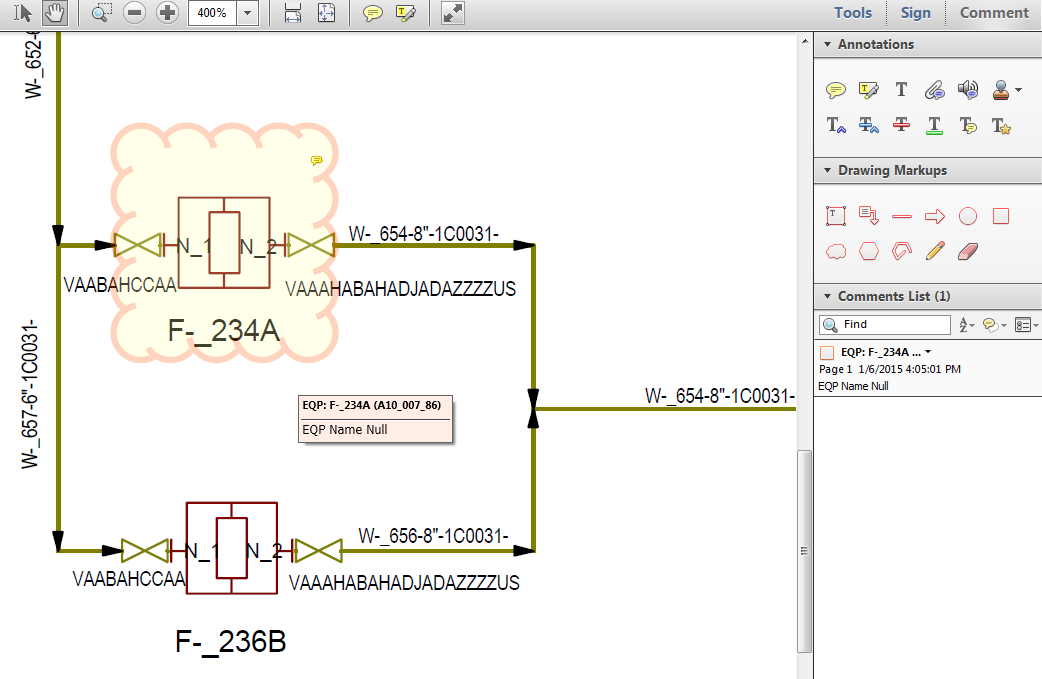
The comments contain:
ObjectType and ItemTag in the first row EQP:F_234A Rule name in the second row EQP Name Null
Tools
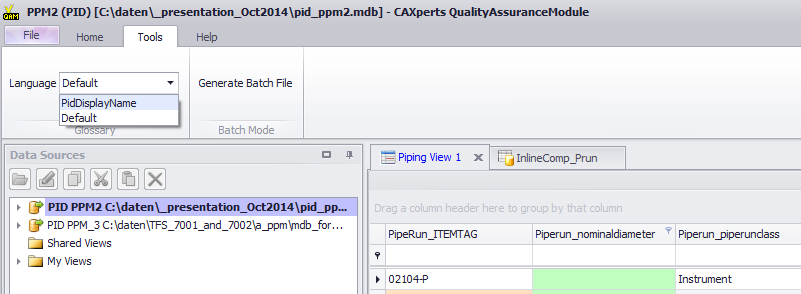
Language
The glossary can be selected. If “Default” is active then the database column names will be displayed, if (in case of SPPID) “PIDDisplayName” is selected then the display names defined in the SPPID plant will be displayed. Unless the user chooses the “PIDDisplayName” he will see the default database column names.
Generate Batch file
If this command is selected the user (admin) will be prompted to select an output file (.xls or .xlsx) and in a second step to select a bat file (text file) which will contain the entries for the command line interface. The parameters are described in Chapter 9.
Log file
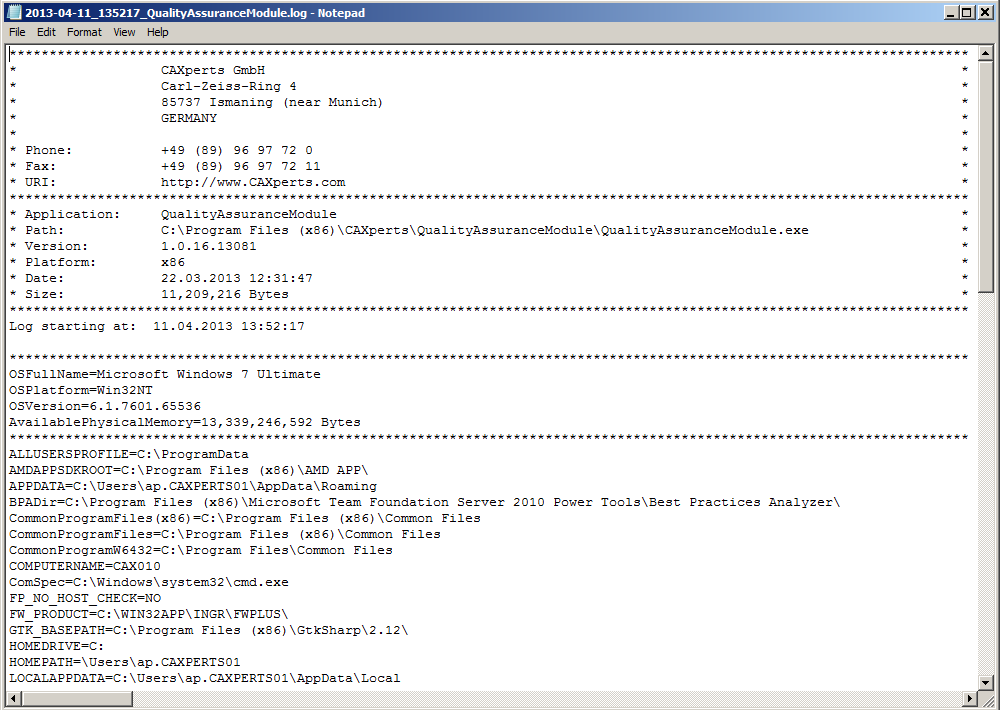 The software creates log
files in the local TEMP directory
(e.g. “C:\Temp\QualityAssuranceModule\”. The user can also open these
files by double-clicking on the CAXperts QualityAssuranceModule status
bar:
The software creates log
files in the local TEMP directory
(e.g. “C:\Temp\QualityAssuranceModule\”. The user can also open these
files by double-clicking on the CAXperts QualityAssuranceModule status
bar: